In our last post “Defending Your Savings Against Significant Downturns“, we presented results for two trend following methods applied to a basket of the 50 largest (by market capitalization) stock ETFs.
We didn’t address tax implications. (Since the trend following methods buy/sell more frequently than buy-and-hold, the trend following methods will subject you to capital gains taxes.) We have since updated that post with the below to make this explicitly clear:
We are not including the tax impact of capital gains in this analysis. There are three reasons for this:
- The focus of this analysis is downside protection, not tax efficiency.
- Retirement funds are frequently held in tax-advantaged accounts.
- The tax impact is complex to calculate and would require additional assumptions.
That said, the impact may be non-zero and we will address this in a future post, so if you hold significant assets in taxable accounts you can understand the impact of capital gains taxes on trend following performance.
In this post, we WILL address the tax impact of capital gains on trend following strategies.
Tax Impacts are Highly Variable
The problem with including the impact of capital gains is that they are not applicable to tax advantaged accounts (401K, traditional/Roth IRA, HSA, etc.), and are otherwise highly variable.
- Long term capital gains tax rates: 0%-20%
- Long term capital gains are taxed at 0% up to income thresholds: $48,350 (Single filers), or $96,700 (Married couples filing jointly)
- Short term capital gains tax rates: taxed at your ordinary income tax rates, which range from 10% to 37% for the 2025 tax year
Since our prior analysis covered the zero tax case, we will select short term capital gains rate of 20% and long term capital gains rate of 35% for this analysis. Thus the prior analysis represents a best case, and this a near worst case. (Not the absolute worst case as we select 35% and not 37% for the short term capital gains tax rate.)
These tax rates are applied to every trade, for each trend following strategy, AND to buy-and-hold results at the end of the analysis period. (Any trades that are open and the conclusion of the analysis are closed and taxes paid at the applicable rate.)
Please review “Defending Your Savings Against Significant Downturns“ for a description of the trend following methods and details of the analysis. We will not repeat that here, and will just proceed straight to the results.
Performance - Stock ETFs
Maximum Drawdown
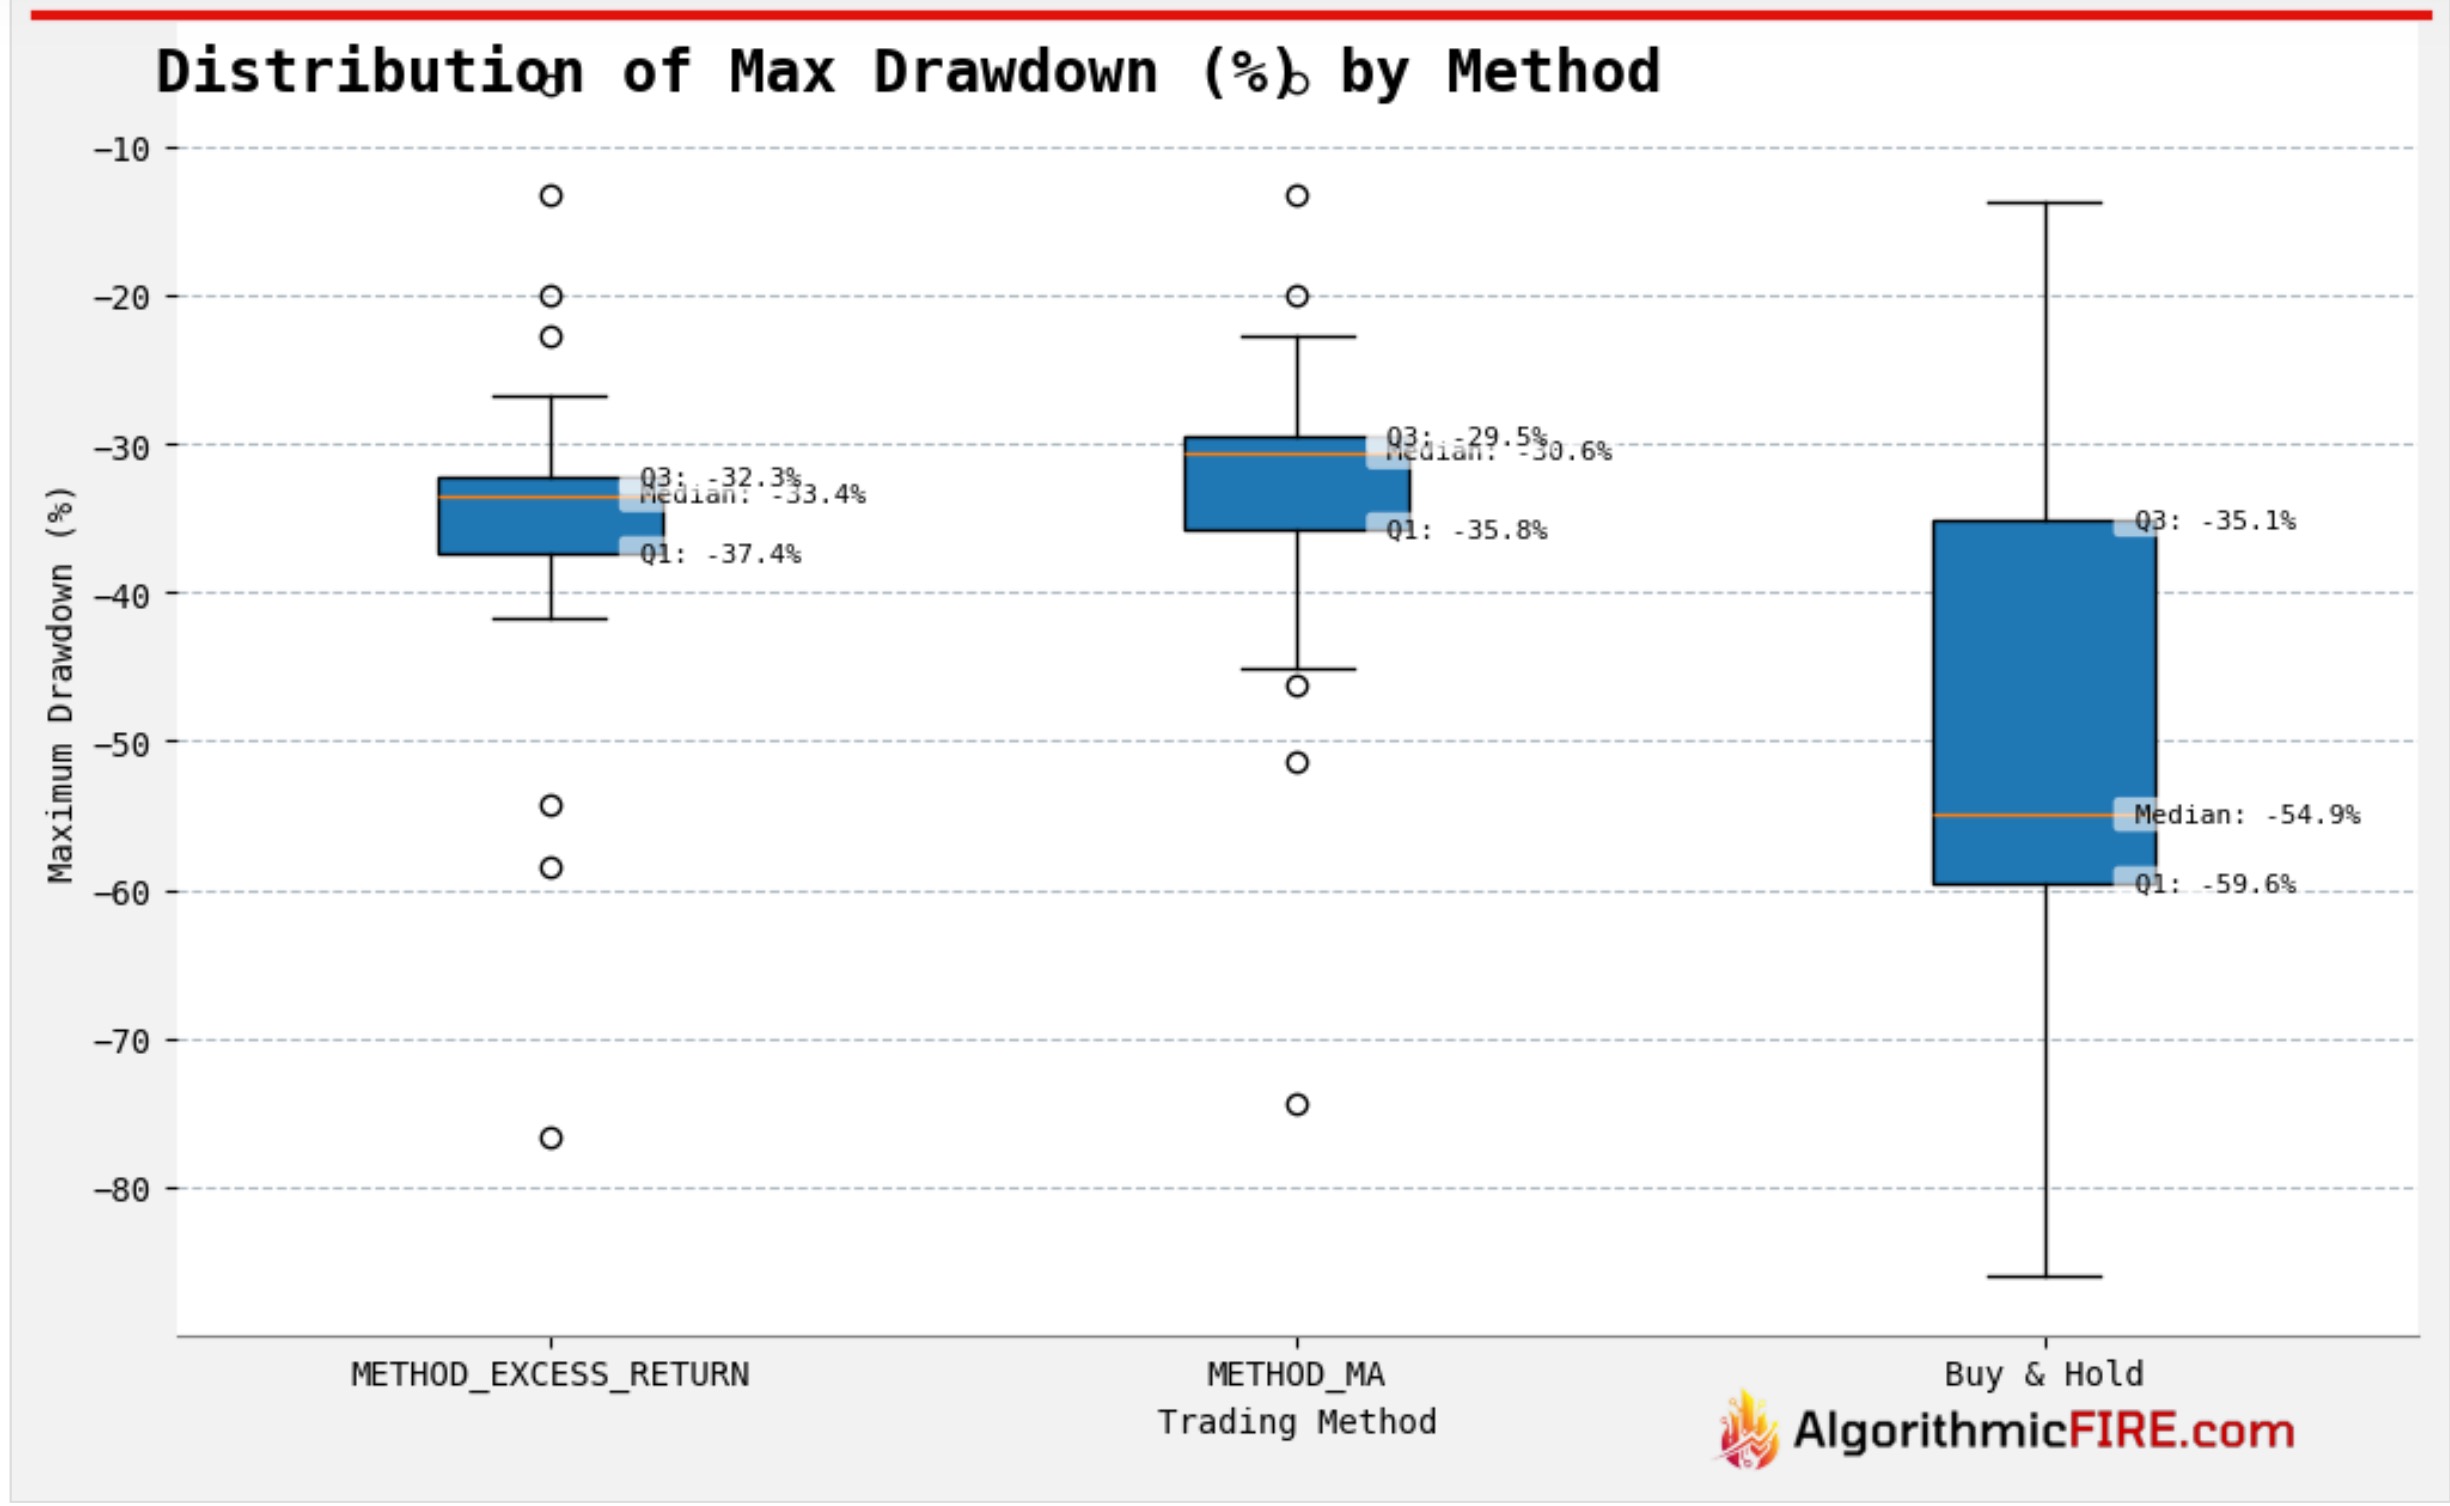
- Median maximum drawdown results are largely unchanged.
- Reference: Median Maximum drawdown with zero capital gains taxes
- Excess return strategy median: -31.6%
- Moving average strategy median: -30.6%
- Buy and hold median: -54.9%
CAGR
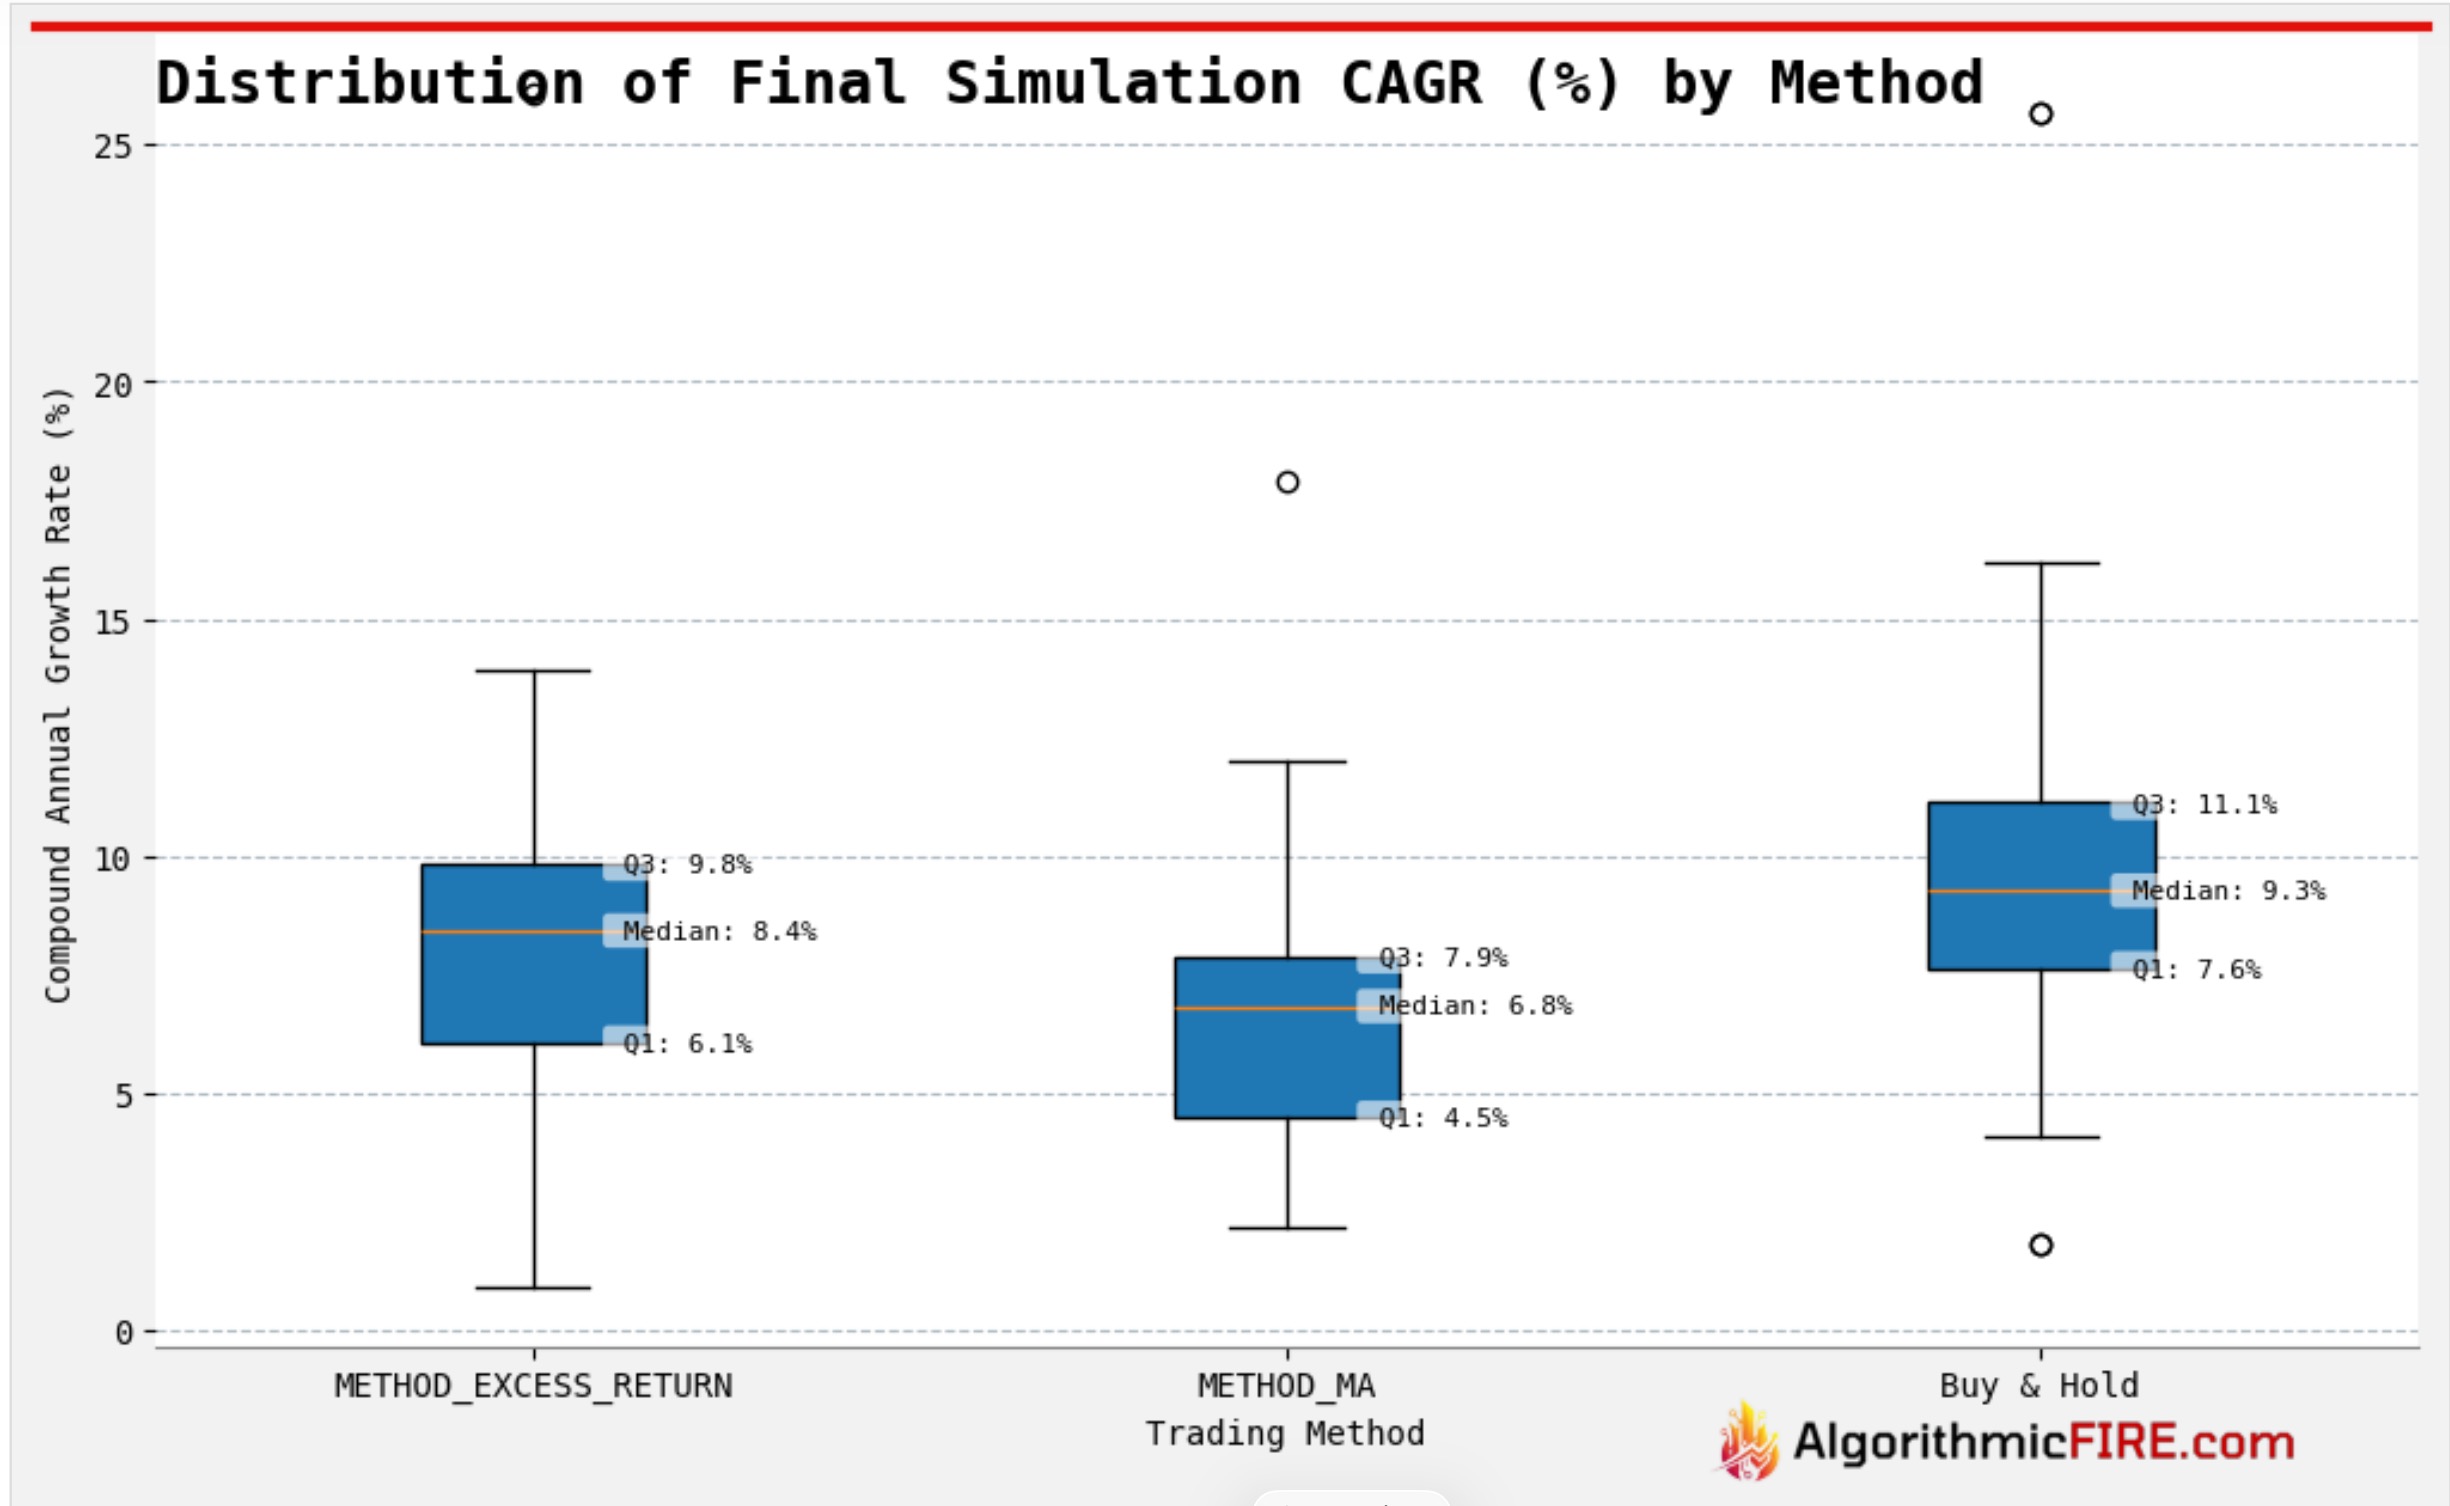
- Median CAGR results decreased for both trend following methods.
- Excess Returns Strategy median CAGR reduced 1.8%.
- Moving Average Strategy median CAGR reduced 1.5%.
- Reference: Median CAGR with zero capital gains taxes
- Excess return strategy: 10.2%
- Moving average strategy: 8.3%
- Buy and hold: 10.3%
Sharpe Ratio
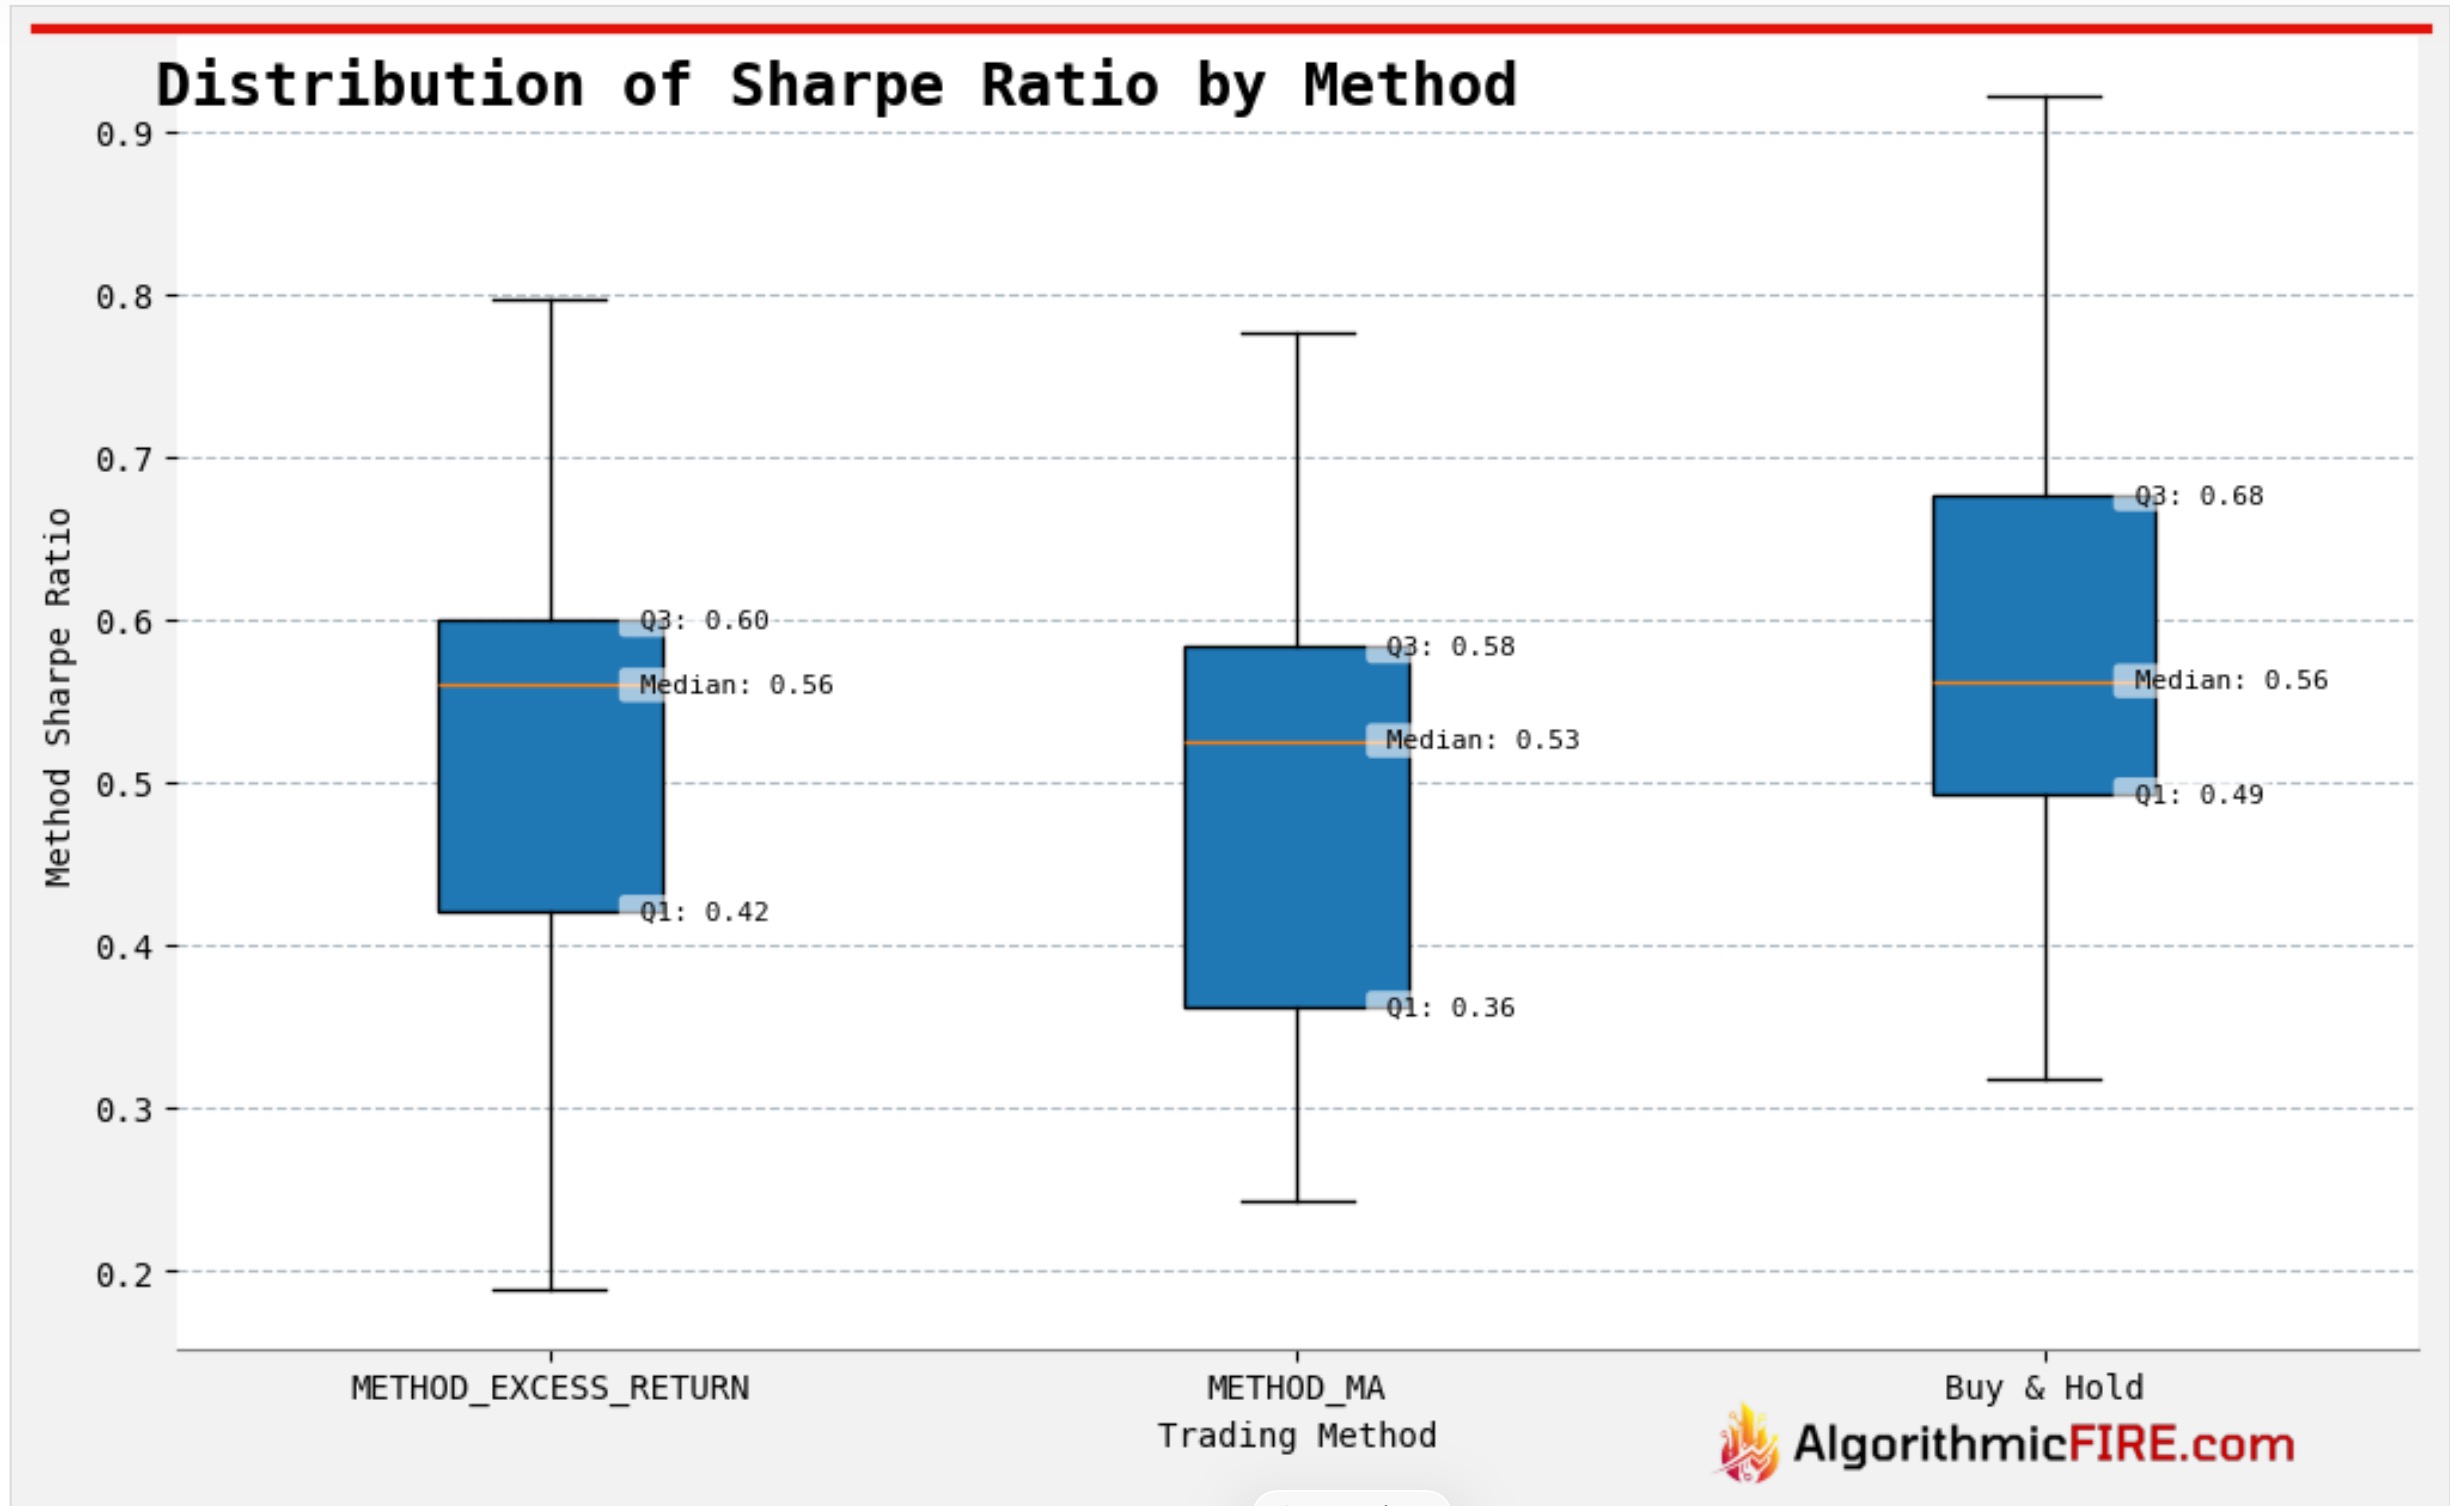
- The advantage seen in the sharpe ratio with no taxes has been eliminated.
- That said, the sharpe ratios are all now quite close, indicating that the loss in CAGR is justifiable considering risk-adjusted returns.
- Reference: Median Sharp Ratio with zero capital gains taxes
- Excess return strategy: 0.67
- Moving average strategy: 0.65
- Buy and hold: 0.56
Performance - Bond ETFs
We didn’t cover bonds in our prior analysis, but decided to add them for this analysis. We selected the 100 largest bond ETFs (by market capitialization) for this analysis.
Maximum Drawdown

- Median maximum drawdowns are reduced significantly with either trend following strategy, but drawdowns are much less than with stock ETFs.
CAGR

- Median CAGR is better with either trend following strategy than buy-and-hold; substantially better with the Excess Return strategy.
Sharpe Ratio
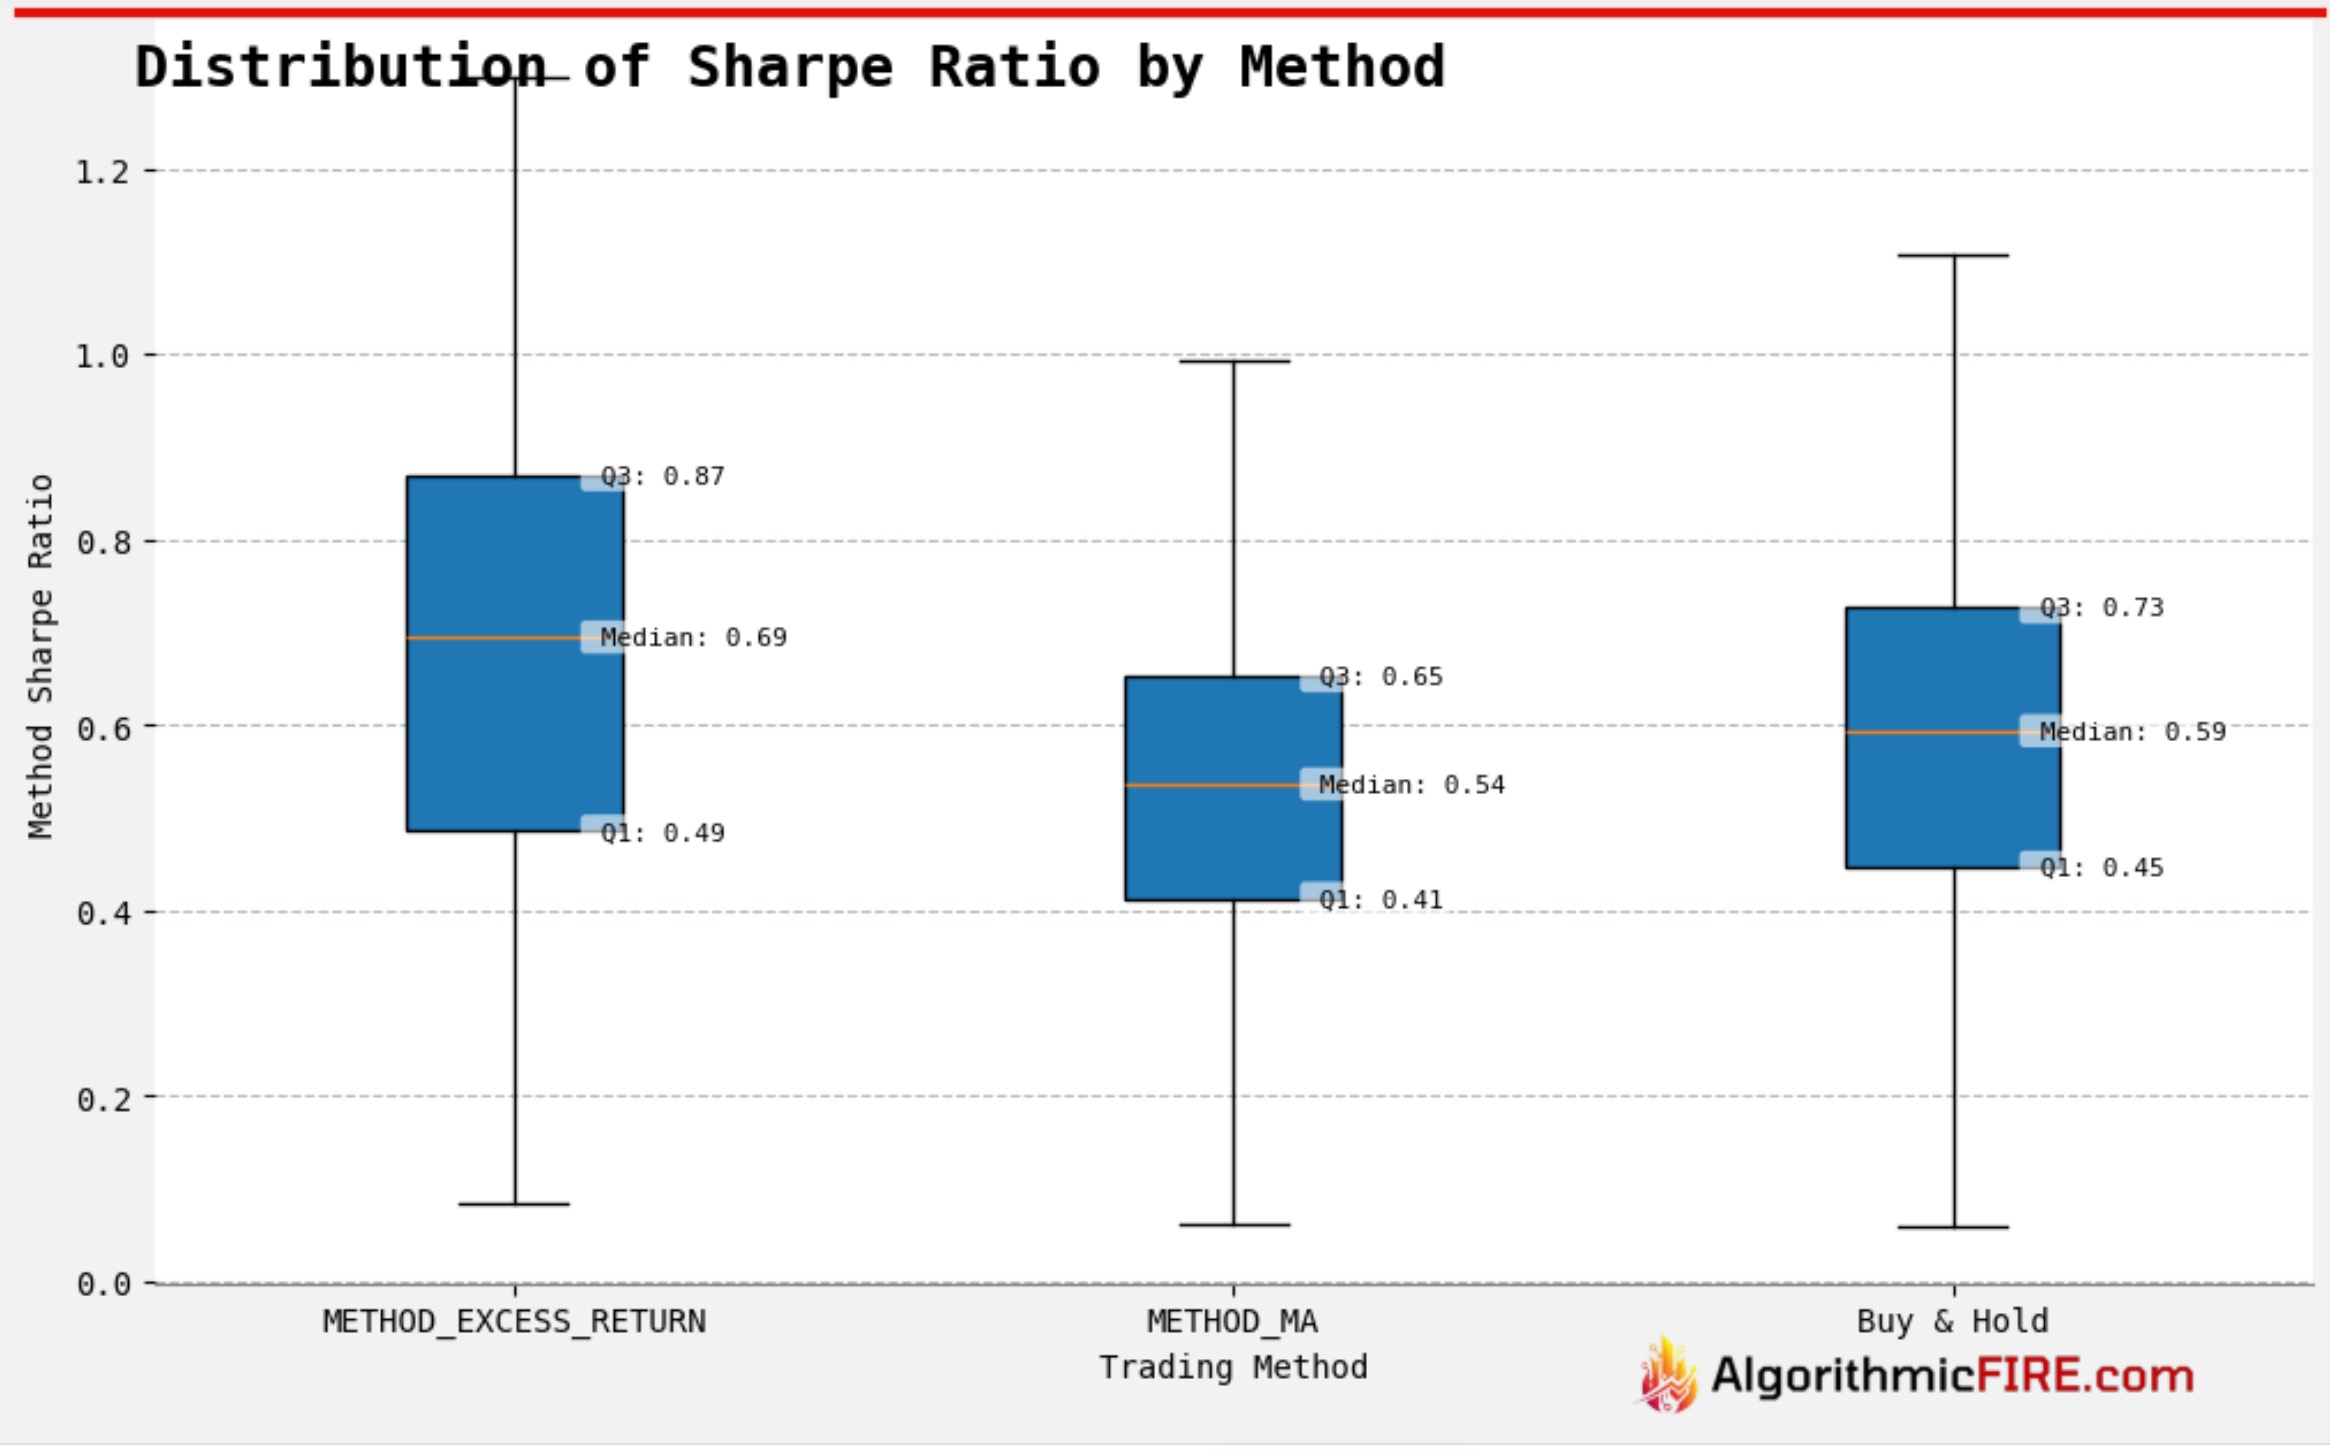
- Sharpe Ratio for the Excess Returns Strategy is significantly higher than buy-and-hold.
- Sharpe Ratio for the Moving Average Strategy trails buy-and-hold, but not by much.
Takeaways
- Either trend following method, applied to either stock or bond ETFs, maintains a significant drawdown advantage over buy-and-hold.
- Our premise of trend following was that the it can be used to reduce drawdowns, at the expense of some CAGR.
- We likened trend following to insurance; the downside protection will cost you a bit of upside.
- CAGR - Stock ETFs
- In a tax advantaged account, the Excess Returns Strategy CAGR with stock ETFs was only 0.1% worse than buy-and-hold.
- With near worst case capital gains tax, the Excess Returns Strategy CAGR is 0.9% worse than buy-and-hold, but the moving average strategy is 2.5% worse than buy-and-hold.
- Thus the downside protection does come at a cost in accounts that are not tax advantaged.
- CAGR - Bond ETFs
- There is no insurance cost; either trend following method does better than buy-and-hold with bond ETFs.
- The Excess Returns Strategy is the better choice of the two trend following methods.
Aggregate Report at Time of Publishing
The data that is published to Google Drive will change each day it is updated. Below you can download the aggregate trade analysis at the time this post was written.
Subscriber Access to All Results, Updated Daily
If you enjoyed this post and would like to follow along, we have shared all results with paid subscribers via Google Drive. If you already paid for a subscription to AlgorithmicFIRE.com, you have access.
Those results include:
- Results for the 100 largest (market capitalization) stock ETFs.
- Results for the 100 largest (market capitalization) stocks.
- Results for the 100 largest (market capitalization) bond ETFs.
- If there are other results you’d like reported on, and you’re a paid subscriber, contact us at algorithmicfire@gmail.com
Google Drive link for results
Ready to learn more?
Dive deeper into investing, saving, and withdrawal strategies through our comprehensive Learning Track.
Prefer updates in your inbox? Subscribe now to get all our content delivered straight to you via email.
Thanks for reading! This post is public so feel free to share it, and follow us on social media:
Disclaimer
**For Educational Purposes Only:** All content on this site, including articles, tools, and simulations, is for informational and educational purposes only. It should not be construed as financial, investment, legal, or tax advice. The information provided is general in nature and not tailored to any individual’s specific circumstances.
**Software Development Has Inherent Risks:** The software used to perform the analyses may have errors or inaccuracies. When we post updates to any material, errors or inaccuracies that are subsequently fixed may change the results.
**No Guarantees & Risk of Loss:** The analyses and simulations presented are based on historical data. Past performance is not an indicator or guarantee of future results. All investing involves risk, including the possible loss of principal. Market conditions are subject to change, and the future may not resemble the past.
**No Fiduciary Relationship:** Your use of this information does not create a fiduciary or professional advisory relationship. We are not acting as your financial advisor.
**Consult a Professional:** You should always conduct your own research and due diligence. Before making any financial decisions, it is essential to consult with a qualified and licensed financial professional who can assess your individual situation and objectives. We disclaim any liability for actions taken or not taken based on the content of this site.
* Nobody associated with Algorithmic Fire LLC has any credential(s) or affiliation(s) with any licensing or regulatory bodies, including but not limited to: Securities and Exchange Commission (SEC), Financial Industry Regulatory Authority (FINRA).
© 2025 Algorithmic Fire LLC. All rights reserved.