How Much Retirement Savings Can Be Accumulated with 30 Years of Saving $1000/month?
Historical analysis shows luck plays a huge roll
In our prior post, It's OK to Put Off Retirement Savings Until You're Older - It's Easier Then..., we analyzed saving at different rates, for different time periods, assuming real returns of 7%.
The astute reader, who read our post on Sequence Of Returns Risk, would have wondered how those results would have changed given actual historic returns, which is what is analyzed below.
Savings Invested in the S&P500
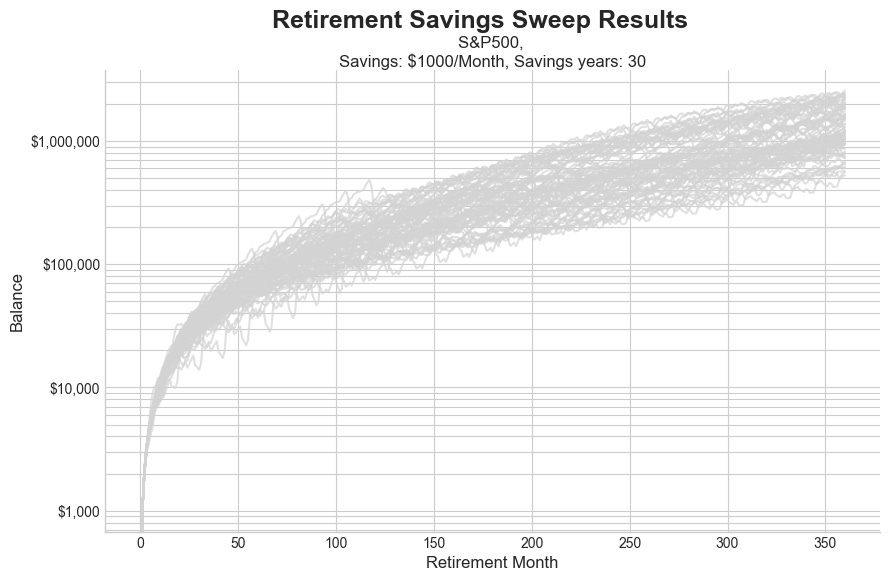
The chart above is the result of simulating 30 years of saving $1000/month, savings are being invested in the S&P500, where savings start in each year from 1929-1995. Each line represents the savings growing over the 30 years for each potential savings starting year from 1929-1995. Note that real returns (inflation adjusted) are used to keep dollar value constant for all years.
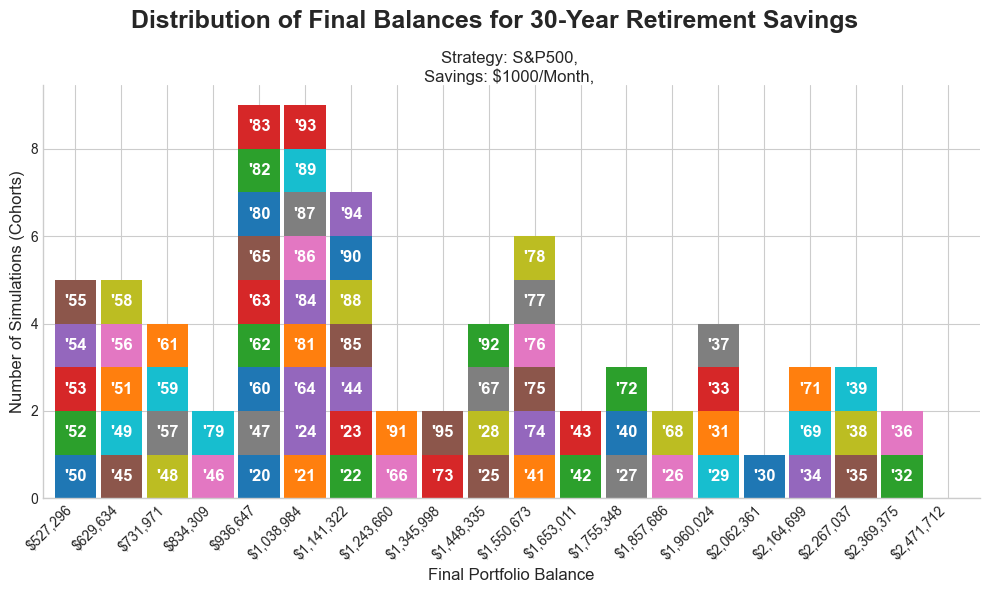
The chart above is a histogram of those returns, with the savings starting year shown in each histogram box. I.E. on the left we can savings starting in years 1950, 1952-1955 had the lowest performance, with final savings balances for those years between $527K - $629K.
Conversely, the late 1930’s was a great time to start saving, with years 1932, 1936, 1935, 1938, and 1939 resulting in savings balances of $2.27M - $2,47M.
- The constant return analysis showed a final savings balance of $1.2M
- Using actual historic returns shows final balances ranging from $527K - $2.4M, with a mean: $1.36M and median: $1.21M
- Following the same savings methodology, the luckiest people wound up retiring with 4.6 times more money than the most unlucky. ($2.4M/$527K=4.6)
Savings Invested 50%/50% (S&P500/Investment Grade Corporate Bonds)
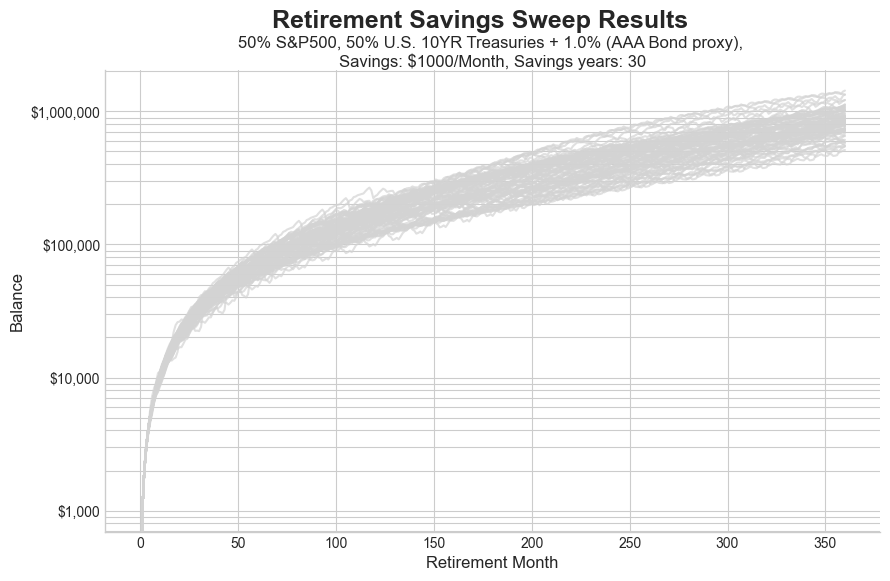
This is a repeat of the analysis above, but now assuming the money is invested in a mix of 50% S&P500 and 50% investment grade corporate bonds. (The actual simulation uses the 10YR U.S. Treasury rates + 1.0% as a proxy for investment grade corporate bonds. Reference: AAA vs 10Y Yield.)
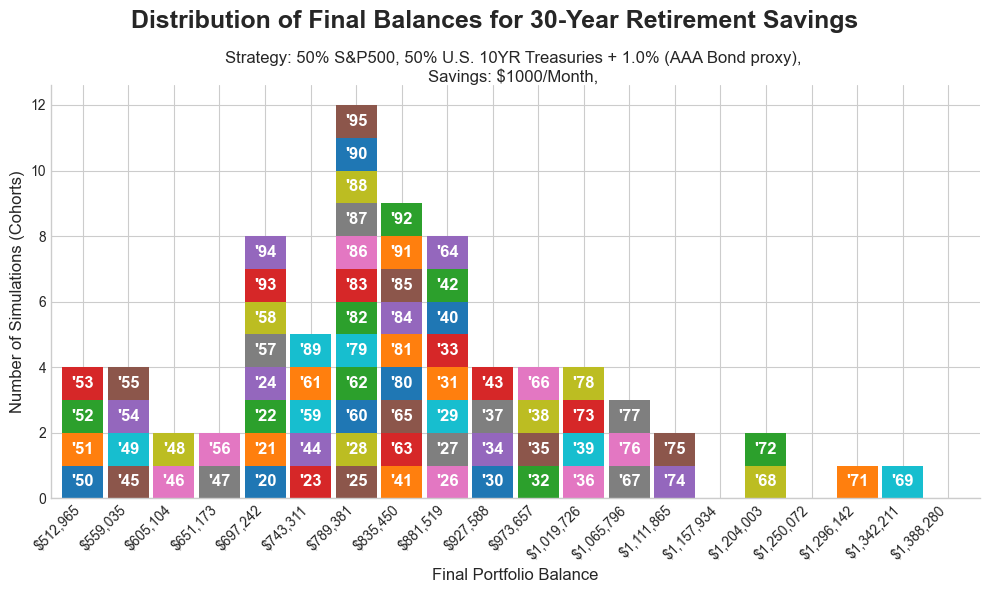
- Using actual historic returns with a mixed portfolio shows final balances ranging from $513K - $1.4M, with a mean: $861K and median: $843K
- Interestingly, while the general results (mean, median, maximum) were better for an all stock portfolio, the worst case results were quite similar ($512K for the mixed portfolio vs $527K for all stocks).
Takeaways
Its import to always keep in mind that while a given portfolio has a long term average return, the following apply:
- Past results are not indicative of future results
- Your milage may vary
Fundamentally, don’t just assume you will get the average return for any given index or portfolio. History is long, but our lives are not; plan for outcomes substantially different than average.
Ready to learn more?
Dive deeper into investing, saving, and withdrawal strategies through our comprehensive Learning Track.
Prefer updates in your inbox? Subscribe via Substack to get all our content delivered straight to you via email.
We love hearing from our readers. If you have questions about this post, or want to suggest a topic for a future article, please use the Chat link on our Substack home page to reach out.
Thanks for reading! This post is public so feel free to share it.
Disclaimer
**For Educational Purposes Only:** All content on this site, including articles, tools, and simulations, is for informational and educational purposes only. It should not be construed as financial, investment, legal, or tax advice. The information provided is general in nature and not tailored to any individual’s specific circumstances.
**Software Development Has Inherent Risks:** The software used to perform the analyses may have errors or inaccuracies. When we post updates to any material, errors or inaccuracies that are subsequently fixed may change the results.
**No Guarantees & Risk of Loss:** The analyses and simulations presented are based on historical data. Past performance is not an indicator or guarantee of future results. All investing involves risk, including the possible loss of principal. Market conditions are subject to change, and the future may not resemble the past.
**No Fiduciary Relationship:** Your use of this information does not create a fiduciary or professional advisory relationship. We are not acting as your financial advisor.
**Consult a Professional:** You should always conduct your own research and due diligence. Before making any financial decisions, it is essential to consult with a qualified and licensed financial professional who can assess your individual situation and objectives. We disclaim any liability for actions taken or not taken based on the content of this site.
* Nobody associated with Algorithmic Fire LLC has any credential(s) or affiliation(s) with any licensing or regulatory bodies, including but not limited to: Securities and Exchange Commission (SEC), Financial Industry Regulatory Authority (FINRA).
© 2025 Algorithmic Fire LLC. All rights reserved.