Success Rates of SWRs
In our post about Safe Withdrawal Rate (SWR), we showed relatively high success rates* for a 5% SWR with a mixed portfolio of stocks/bonds. But that was using simulated returns.
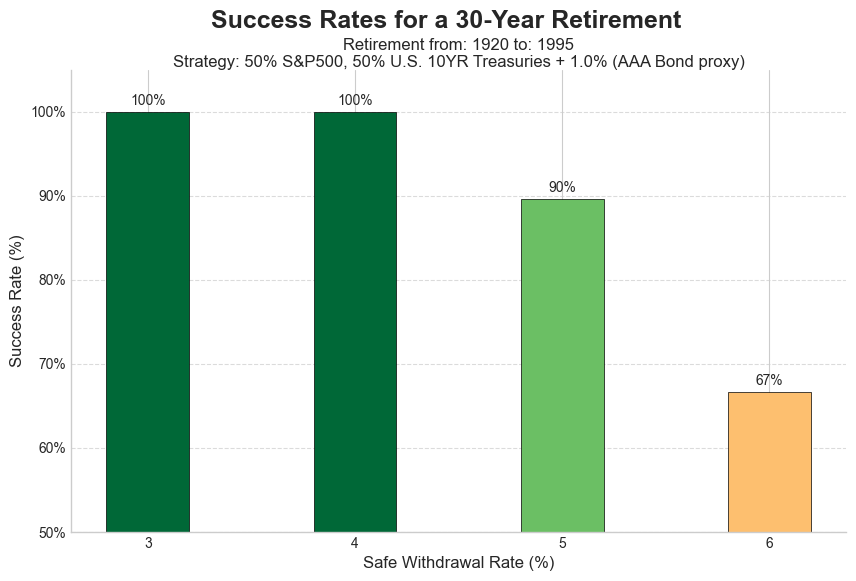
This chart shows the success rates using historical data going back to 1920. This portfolio is using 50% S&P500, and 50% bonds.
But what does 90% success for a 5% SWR mean? What does failure look like?
* This is not an endorsement for a 5% SWR. The intent is to show what happens when your SWR is too high.
Some Simulation Details
The modeled portfolio consists of 50% S&P500, and 50% bonds. (The actual simulation uses the 10YR U.S. Treasury rates + 1.0% as a proxy for investment grade corporate bonds. Reference: AAA vs 10YR Yield)
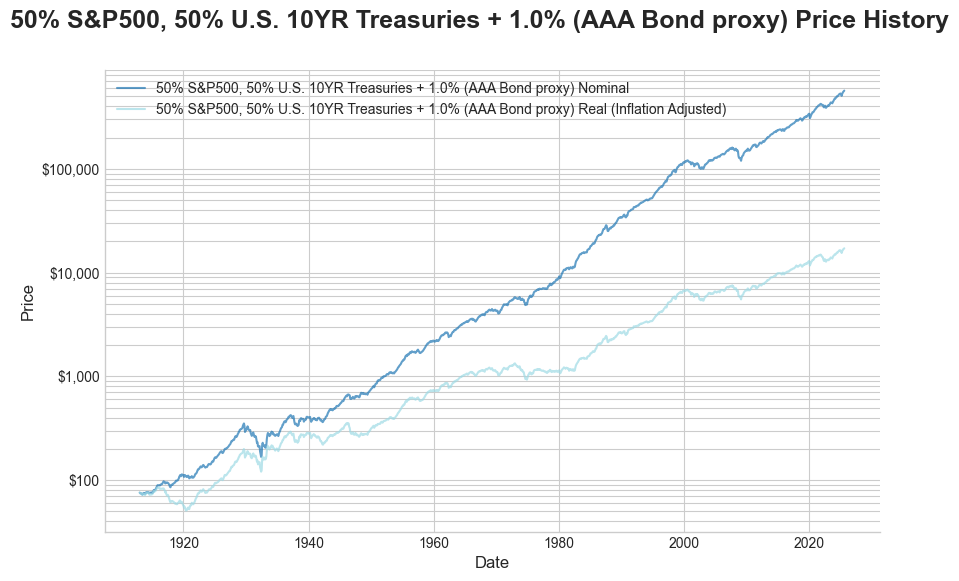
The chart shows nominal and real returns of this portfolio since 1913.
A 30 year retirement is modeled for years prior to 1995 after which the model stops at 2025.
Inflation matters
Note that in the 1960’s, nominal returns seem to follow the general upward trend, but the real return is flat. The nominal returns were similar to inflation; purchasing power stayed flat.
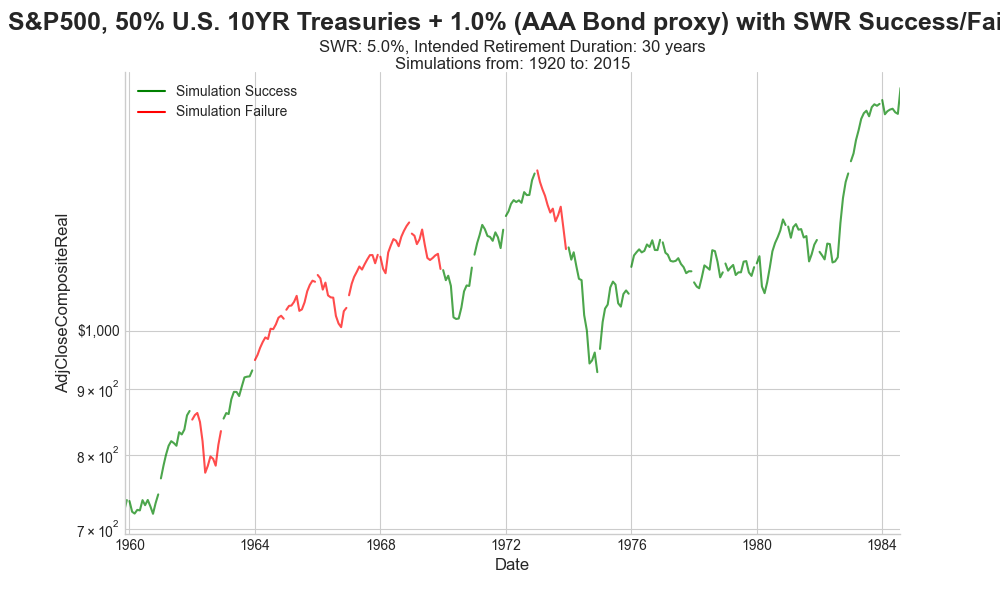
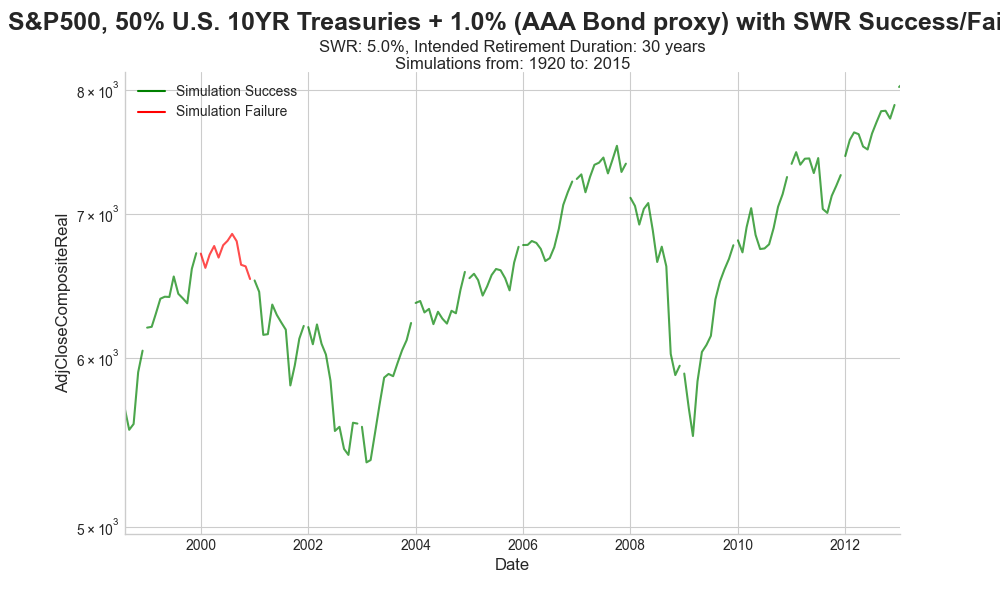
Failures Aren’t Random
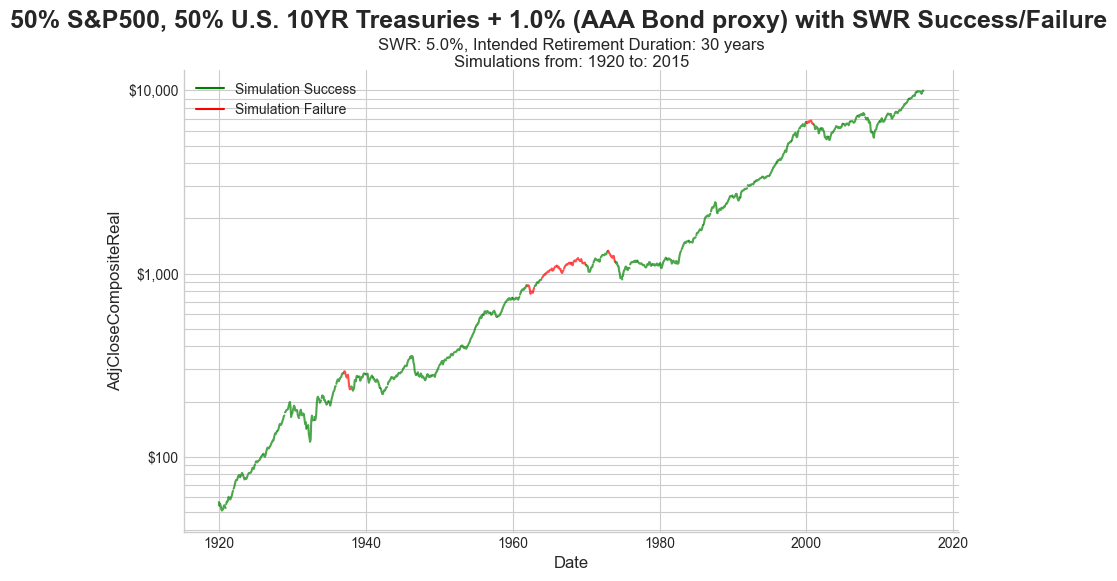
This chart shows success/failures mapped onto the real return data; red means a retirement that started that year ran out of money.
Note that the “failure year” is the starting year of retirement, not the year the balance hit zero.
Key finding
The failures are clustered: 1937, 1962-69 (most years), 1973, 2000
Failure Details
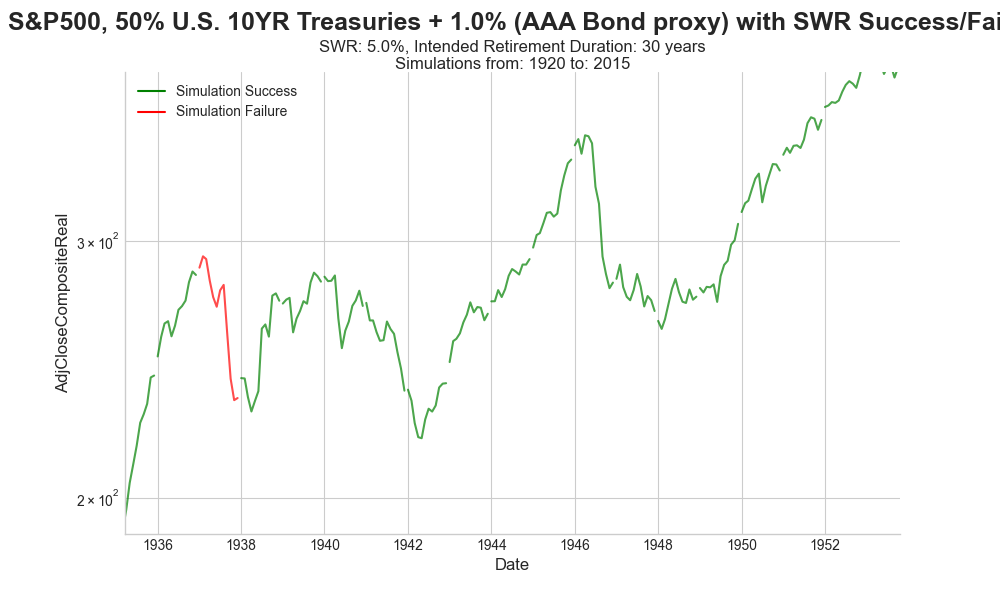
- Failures occurred when retirement started in the years: 1937, 1962, 1964, 1965, 1966, 1967, 1968, 1969, 1973, 2000
- Years until failure: 24, 29, 29, 26, 24, 28, 24, 23, 28, 24
- 4 of 10 failures occurred in years 28-30; so close…
- All failures occurred at year 23 or later.
Critical insight
The failures occurred deep into retirement, long after the SWR was chosen. It would have been easy to not see failure coming until it was too late.
Key Finding
The failures all occur when retirements start prior to a long period of near zero real returns. See the following charts...
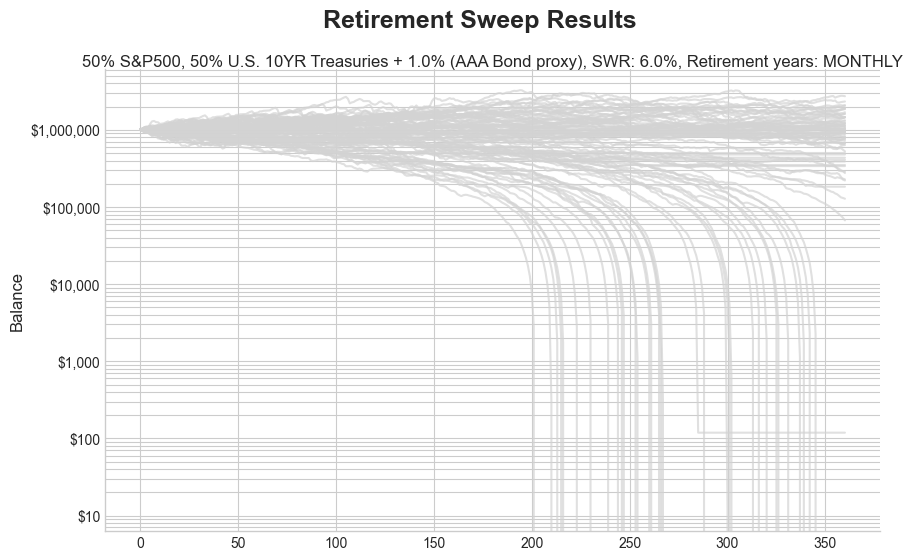
How did you go bankrupt?
Two ways. Gradually, then suddenly
Ernest Hemingway, The Sun Also Rises, 1926
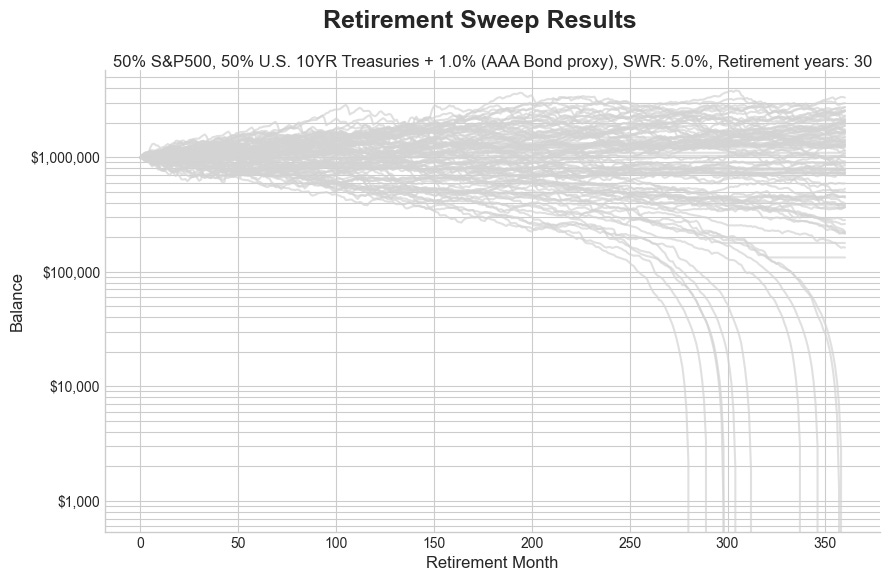
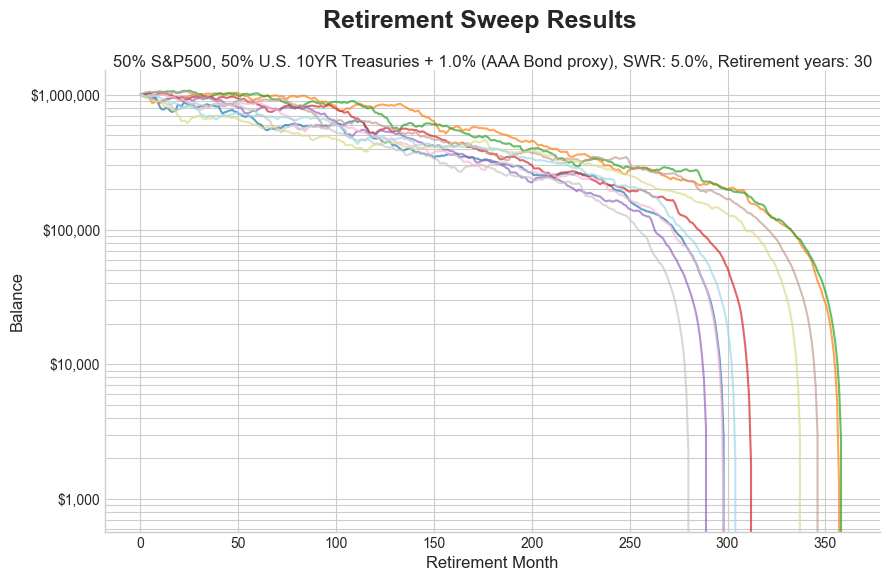
The above charts show the simulated balance vs time; the top chart is all runs, while the bottom chart is ONLY failing runs.
At 15 years into retirement (180 months), the failing simulations had depleted the account to around half it starting value
Insights on a 5% SWR, and 90% Success
5% is robust-ish
- It survived the Great Depression years.
- There were three periods of extended low real return that produced clusters of failures.
Beware of low real returns
- History shows that the periods of low real return have been more dangerous than large corrections which recover (Depression, Great Financial Crisis).
- Keep an eye on REAL returns and adjust spending/income if needed.
Timing
- You may not time the market, but it may time you.
- Timing plays a critical role in having a successful retirement.
What if Timing Fails?
- Compare your SWR inflation adjustments to investment returns. If real returns are near zero for more than a few years, reduce spending or increase income (go back to work).
- Going back to work doesn’t have to mean full time and your old career. You need enough to get your SWR down enough to ride out the economic cycle.
- Reducing your SWR from 5% to 3.5% means you need to generate 30% of your income. (5%-3.5%)/5% = 30%.
- Make sure you are considering all your investment options. Just because your economy is bad doesn’t mean other markets aren’t doing better.
Key Takeaways
This analysis focuses on a 5% SWR, only to demonstrate what failure looks like.
- Failure is likely to happen deep into retirement, at a time you may not be able or willing to return to work.
- Keep your SWR conservative (not 5%) and aim to allow a better lifestyle to come from a conservative SWR on a balance that has compounded, and thus you are getting more income from the conservative SWR.
- Monitor real returns to make sure your withdrawal rate is actually safe; adjust spending/income if needed.
- Monitor returns in alternative investments/markets, stay diversified.
Adjusting Your SWR
There are several proposals for how to deal with failing scenarios, generally using some type of “guardrails” approach. The idea is to formulaically change your SWR based on particular rates of return.
Our preference, aligned with our “keep it simple, keep it memorable” approach is to reevaluate your withdrawal rate each year and verify it is still a SWR; in particular take action if your withdrawal rate increased too much due to loss of principal.
That begs the question, how does SWR change as retirement horizon reduces. That will be the subject of one of our next posts.
If 5% Isn’t so Bad, What About 6%?
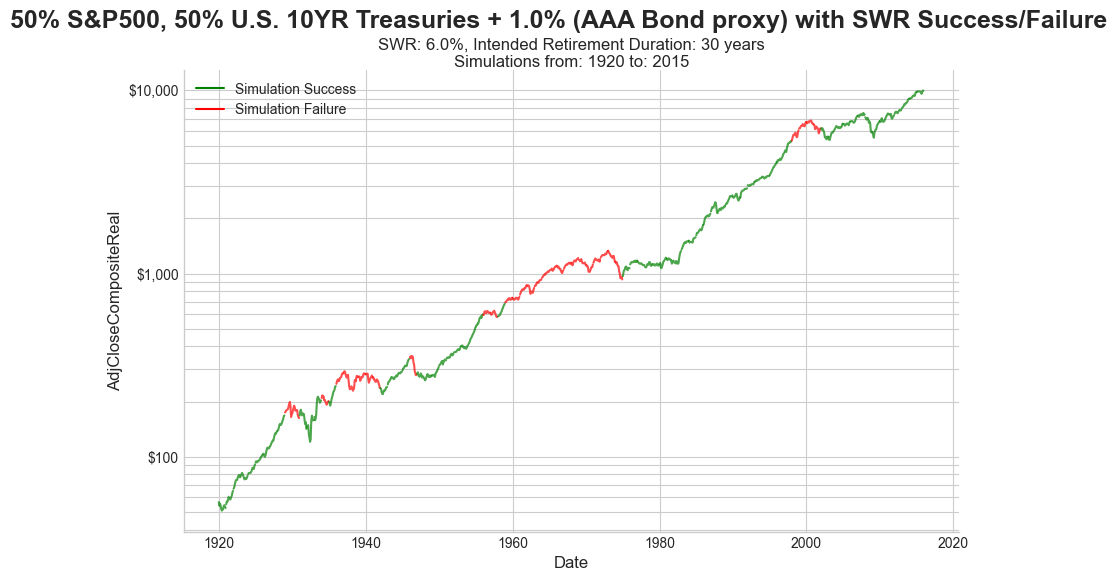
The success rate drops to 67%, the failure clusters get longer, and failure occurs as soon as about 16 years.
Kids - DO NOT try this at home…
Wait - What Were The Best Cases?

Earlier we showed the chart above, with account balances plotted vs time.
The astute reader will ask “there are cases where the account value INCREASES to $2M-3M?”.
The answer is “yes”.
More details regarding that in an upcoming analysis.
We now have online calculators that can duplicate most of our analyses.
Run them to see the results for whatever scenario(s) you prefer.
Ready to learn more?
Dive deeper into investing, saving, and withdrawal strategies through our comprehensive Learning Track.
Prefer updates in your inbox? Subscribe now to get all our content delivered straight to you via email.
Thanks for reading! This post is public so feel free to share it, and follow us on social media:
Disclaimer
**For Educational Purposes Only:** All content on this site, including articles, tools, and simulations, is for informational and educational purposes only. It should not be construed as financial, investment, legal, or tax advice. The information provided is general in nature and not tailored to any individual’s specific circumstances.
**Software Development Has Inherent Risks:** The software used to perform the analyses may have errors or inaccuracies. When we post updates to any material, errors or inaccuracies that are subsequently fixed may change the results.
**No Guarantees & Risk of Loss:** The analyses and simulations presented are based on historical data. Past performance is not an indicator or guarantee of future results. All investing involves risk, including the possible loss of principal. Market conditions are subject to change, and the future may not resemble the past.
**No Fiduciary Relationship:** Your use of this information does not create a fiduciary or professional advisory relationship. We are not acting as your financial advisor.
**Consult a Professional:** You should always conduct your own research and due diligence. Before making any financial decisions, it is essential to consult with a qualified and licensed financial professional who can assess your individual situation and objectives. We disclaim any liability for actions taken or not taken based on the content of this site.
* Nobody associated with Algorithmic Fire LLC has any credential(s) or affiliation(s) with any licensing or regulatory bodies, including but not limited to: Securities and Exchange Commission (SEC), Financial Industry Regulatory Authority (FINRA).
© 2025 Algorithmic Fire LLC. All rights reserved.