In our last post “Defending Your Savings Against Significant Downturns“, we presented results for two trend following methods applied to a basket of the 50 largest (by market capitalization) stock ETFs.
We didn’t address tax implications. (Since the trend following methods buy/sell more frequently than buy-and-hold, the trend following methods will subject you to capital gains taxes.) We have since updated that post with the below to make this explicitly clear:
We are not including the tax impact of capital gains in this analysis. There are three reasons for this:
- The focus of this analysis is downside protection, not tax efficiency.
- Retirement funds are frequently held in tax-advantaged accounts.
- The tax impact is complex to calculate and would require additional assumptions.
That said, the impact may be non-zero and we will address this in a future post, so if you hold significant assets in taxable accounts you can understand the impact of capital gains taxes on trend following performance.
In this post, we WILL address the tax impact of capital gains on trend following strategies.
Tax Impacts are Highly Variable
The problem with including the impact of capital gains is that they are not applicable to tax advantaged accounts (401K, traditional/Roth IRA, HSA, etc.), and are otherwise highly variable.
- Long term capital gains tax rates: 0%-20%
- Long term capital gains are taxed at 0% up to income thresholds: $48,350 (Single filers), or $96,700 (Married couples filing jointly)
- Short term capital gains tax rates: taxed at your ordinary income tax rates, which range from 10% to 37% for the 2025 tax year
Since our prior analysis covered the zero tax case, we will select a short term capital gains rate of 35% and long term capital gains rate of 20% for this analysis. Thus the prior analysis represents a best case, and this a near worst case. (Not the absolute worst case as we selected 35% and not 37% for the short term capital gains tax rate.)
These tax rates are applied to every trade, for each trend following strategy, AND to buy-and-hold results at the end of the analysis period. (Any trades that are open at the conclusion of the analysis are closed and taxes paid at the applicable rate.)
Please review “Defending Your Savings Against Significant Downturns“ for a description of the trend following methods and details of the analysis. We will not repeat that here, and will just proceed straight to the results.
Performance - Stock ETFs
Maximum Drawdown
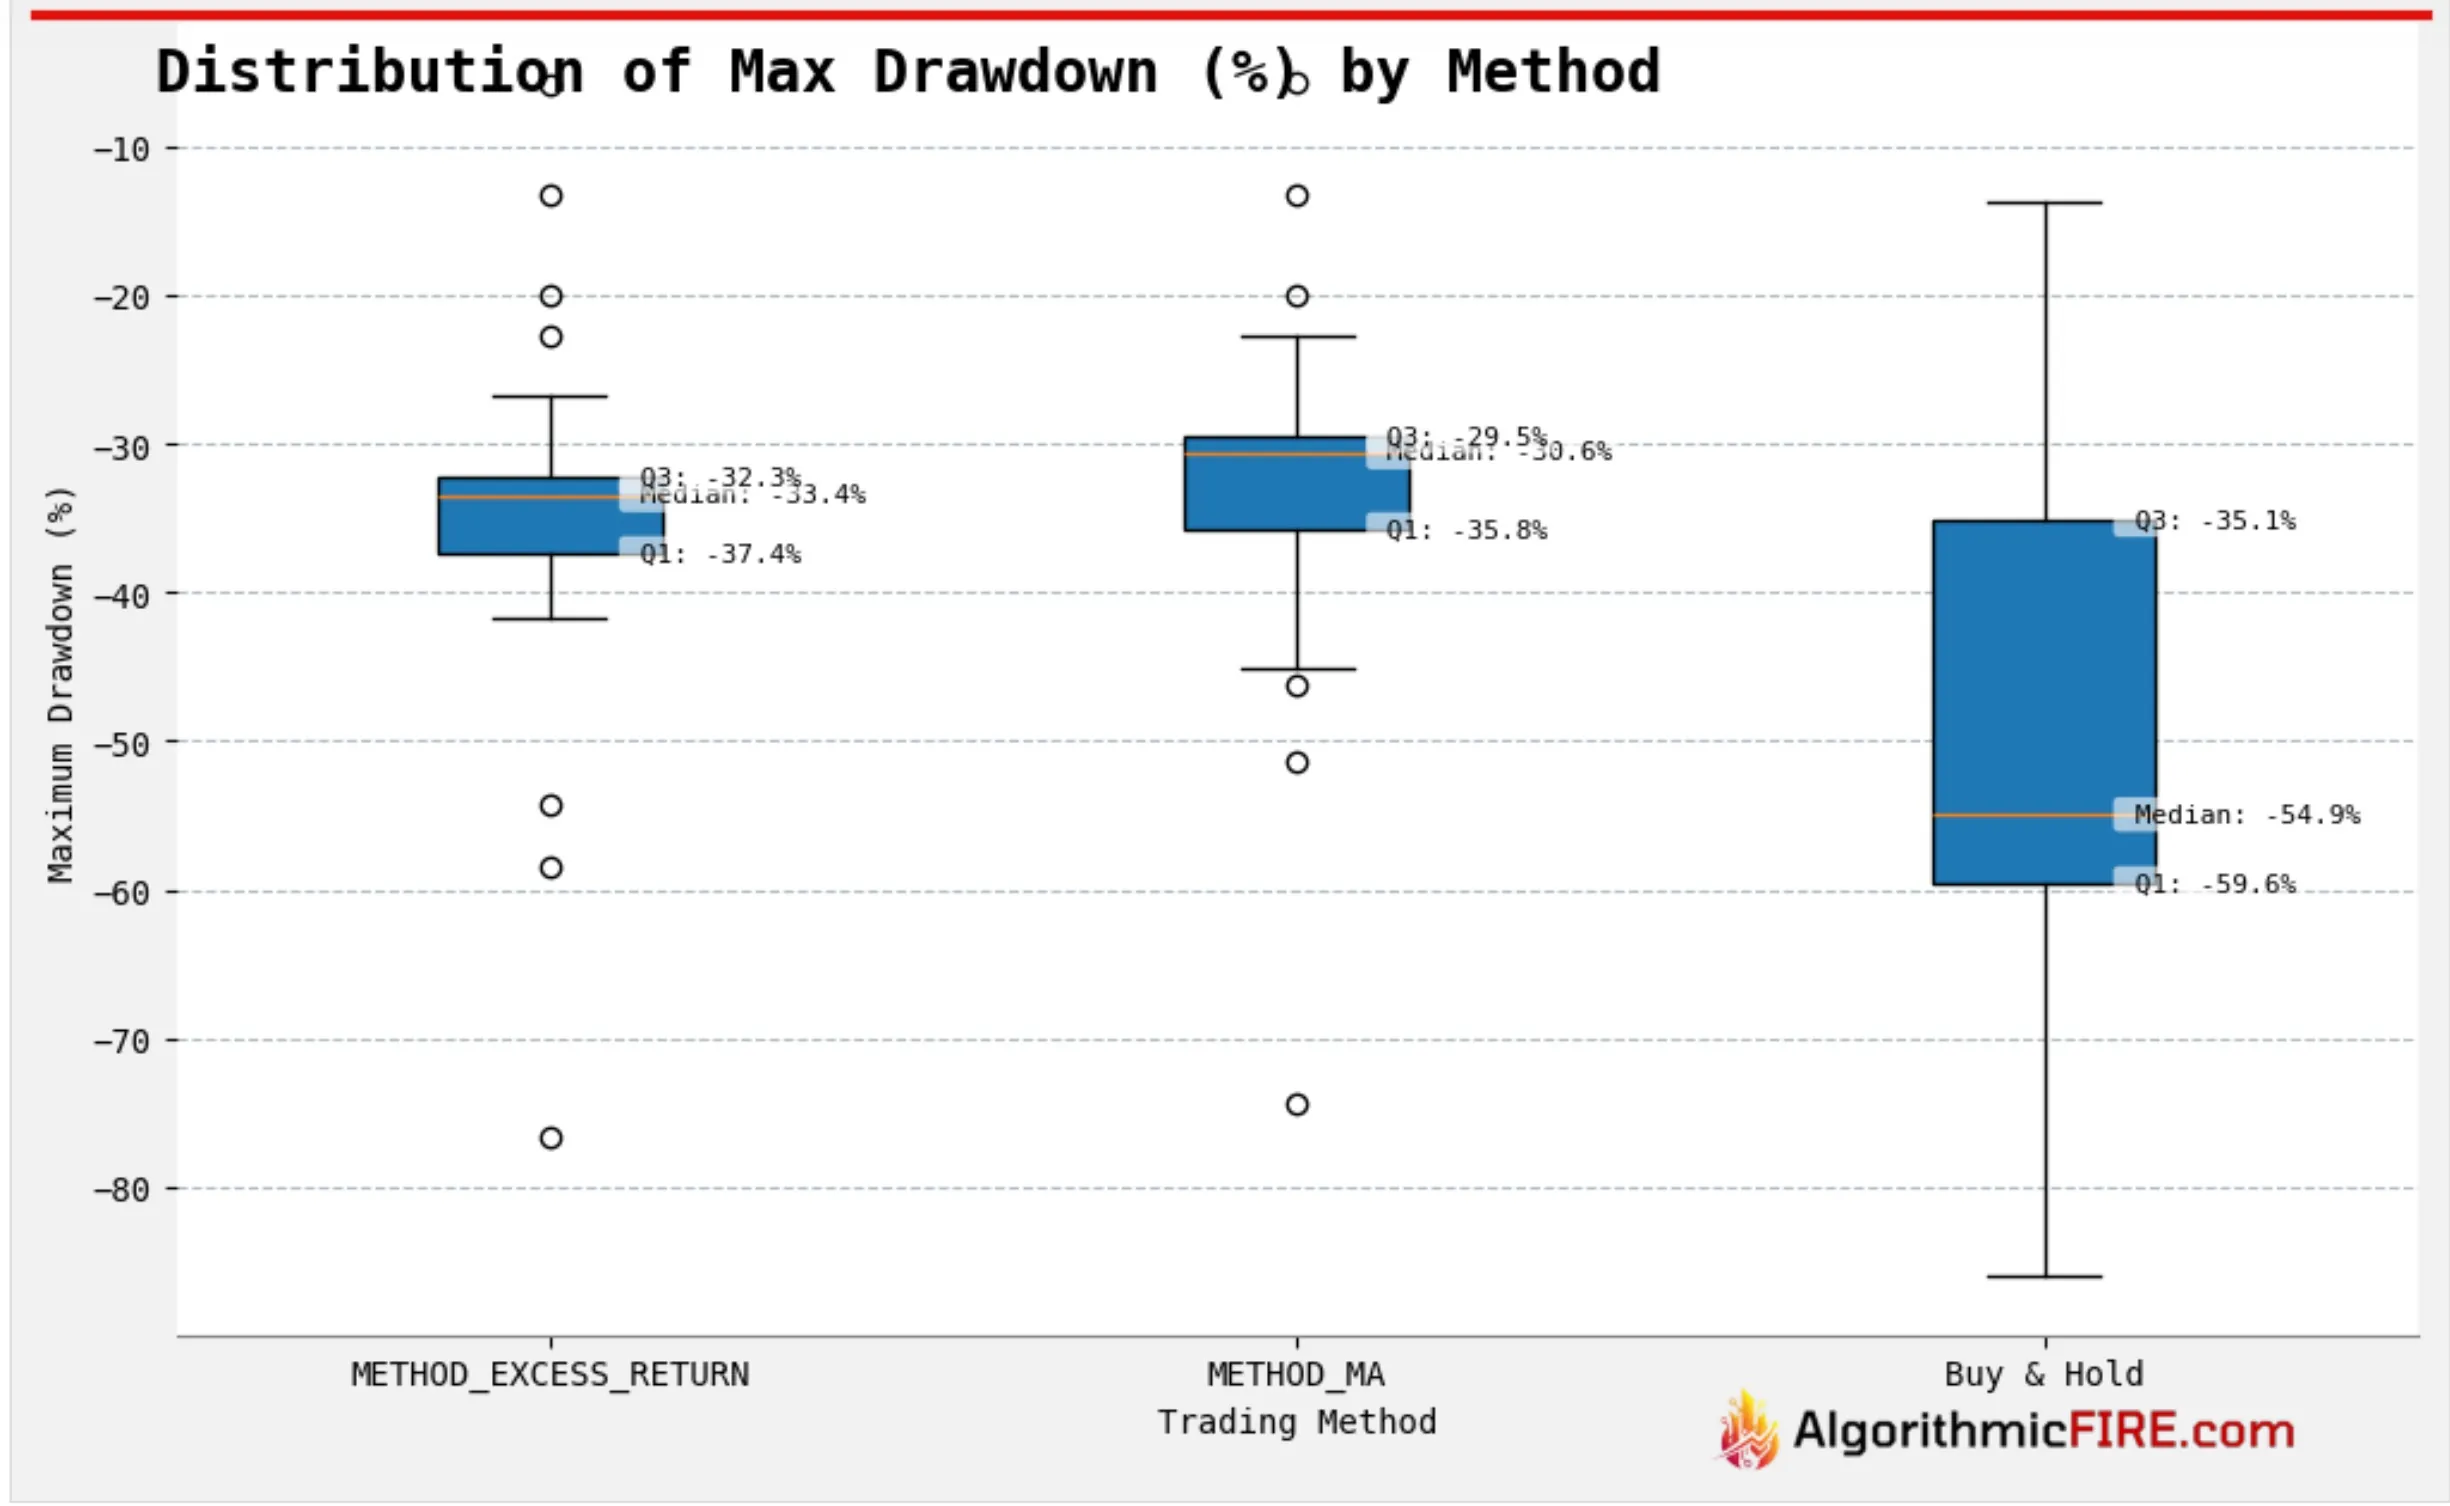
- Median maximum drawdown results are largely unchanged.
- Reference: Median Maximum drawdown with zero capital gains taxes
- Excess return strategy median: -31.6%
- Moving average strategy median: -30.6%
- Buy and hold median: -54.9%
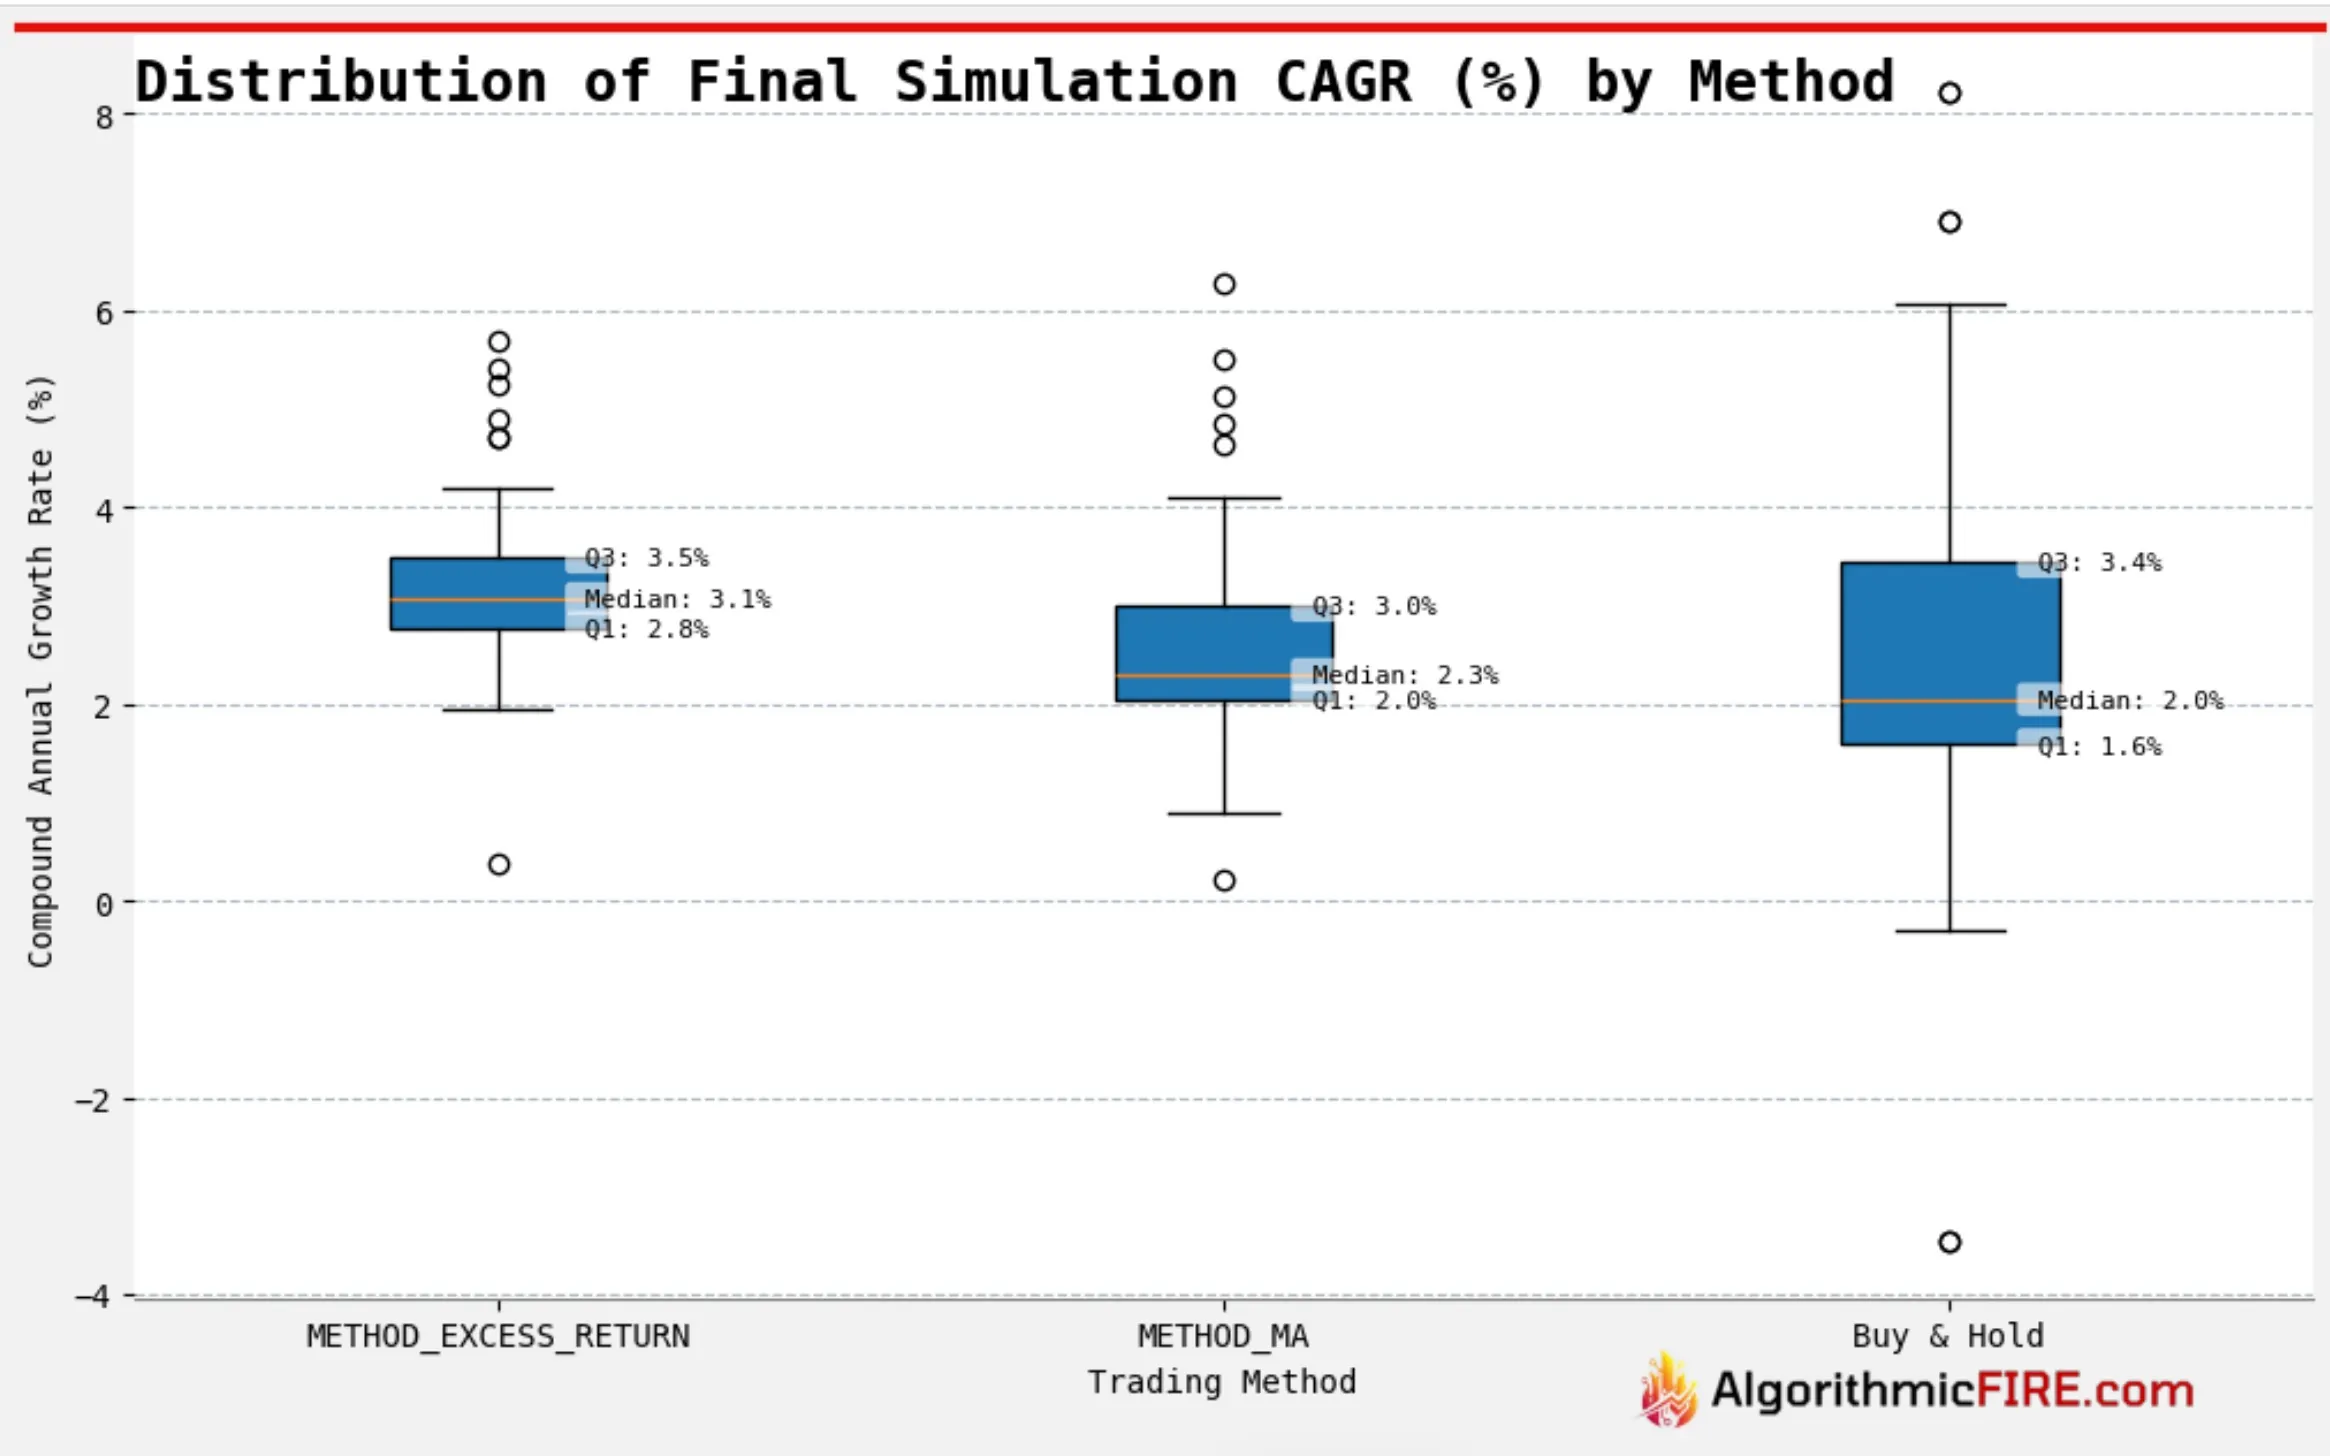
CAGR
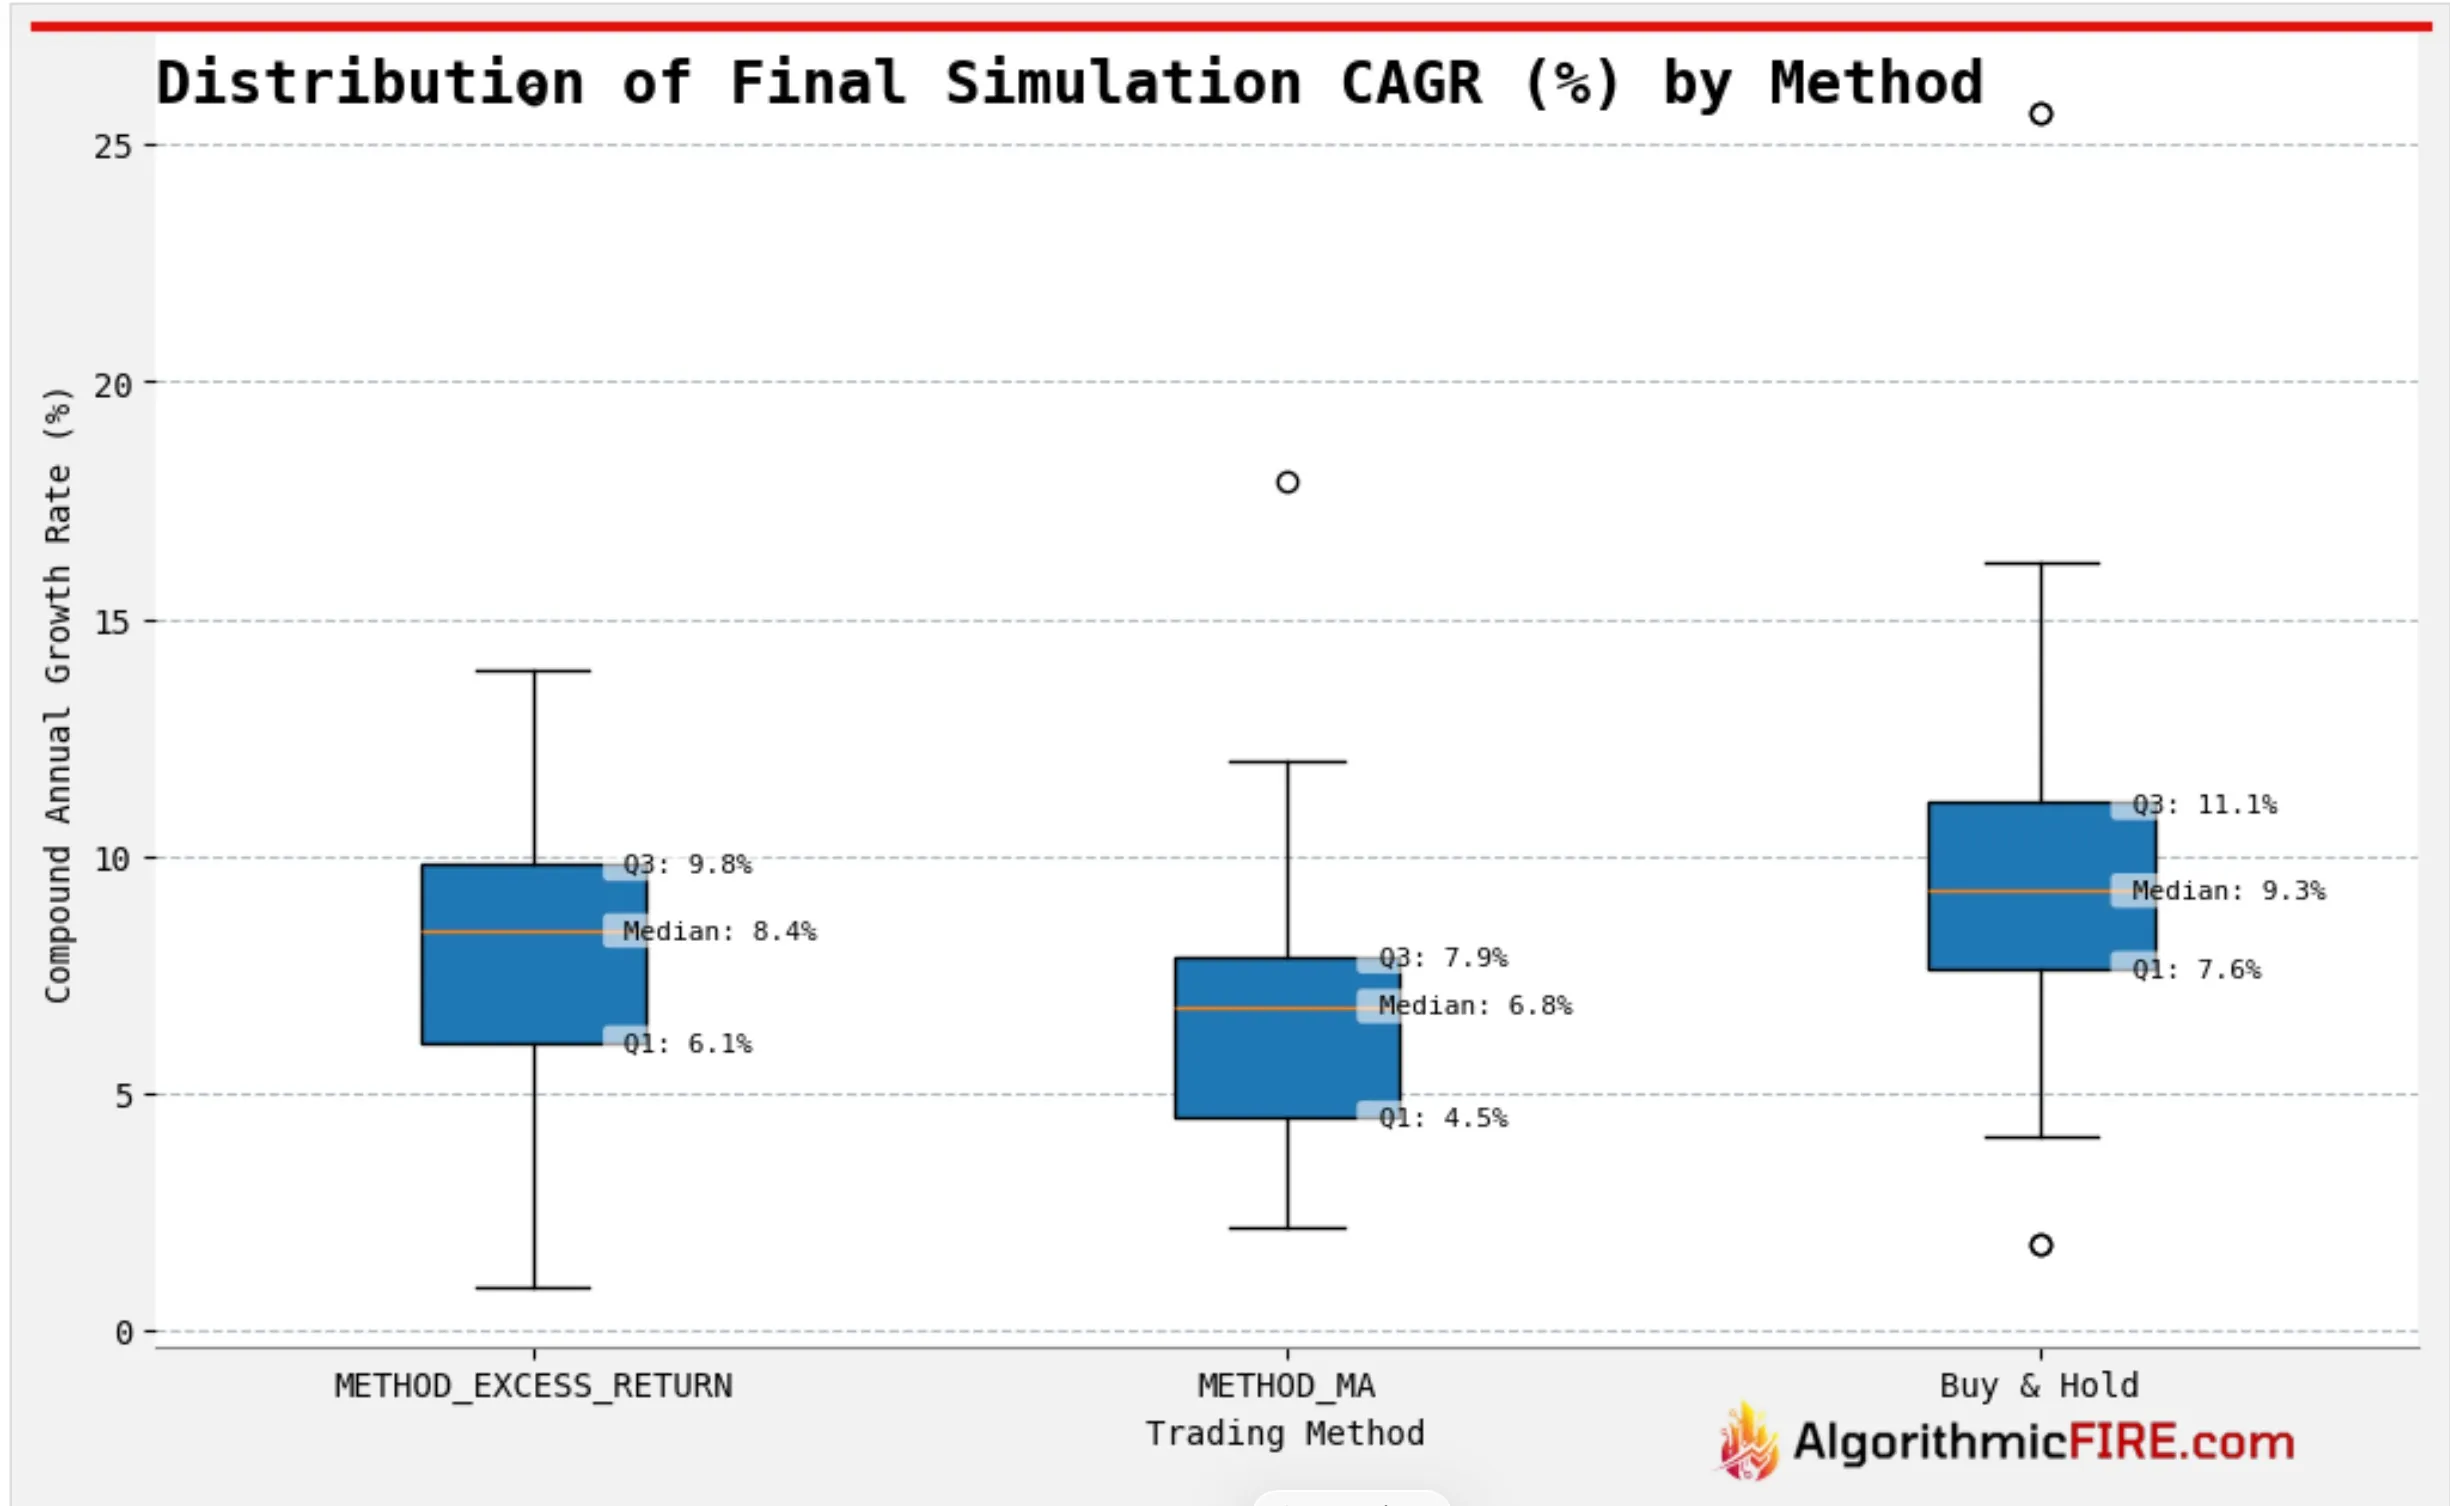
- Median CAGR results decreased for both trend following methods.
- Excess Returns Strategy median CAGR reduced 1.8%.
- Moving Average Strategy median CAGR reduced 1.5%.
- Reference: Median CAGR with zero capital gains taxes
- Excess return strategy: 10.2%
- Moving average strategy: 8.3%
- Buy and hold: 10.3%
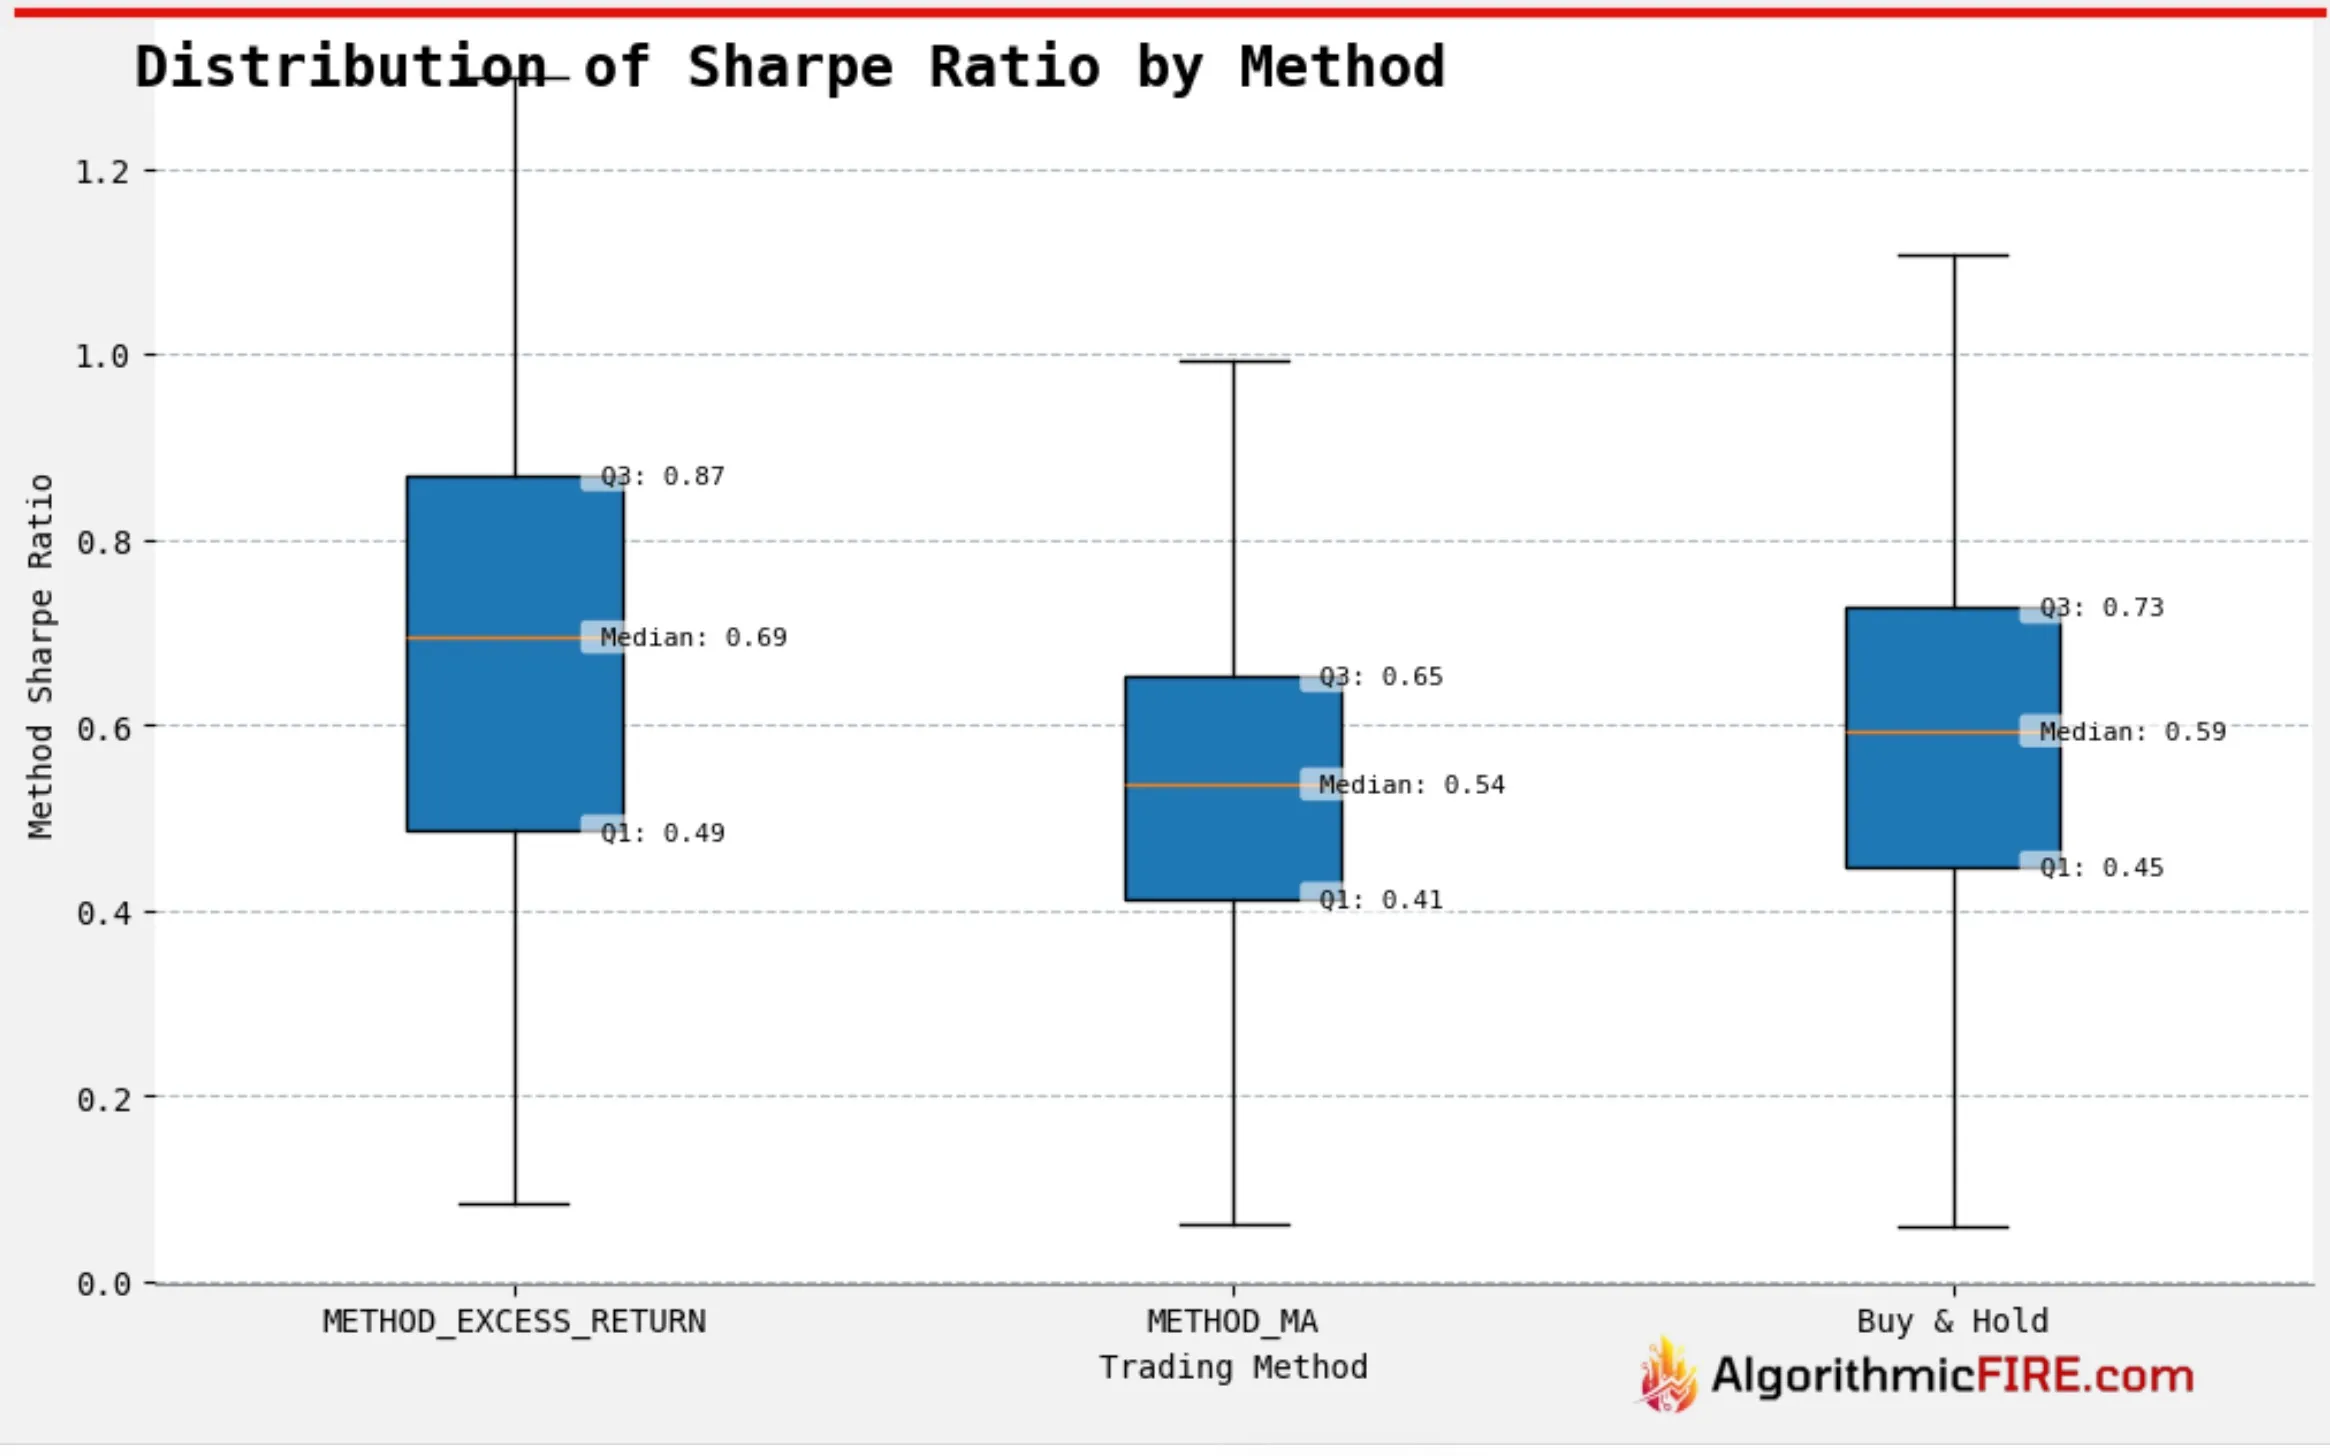
Sharpe Ratio
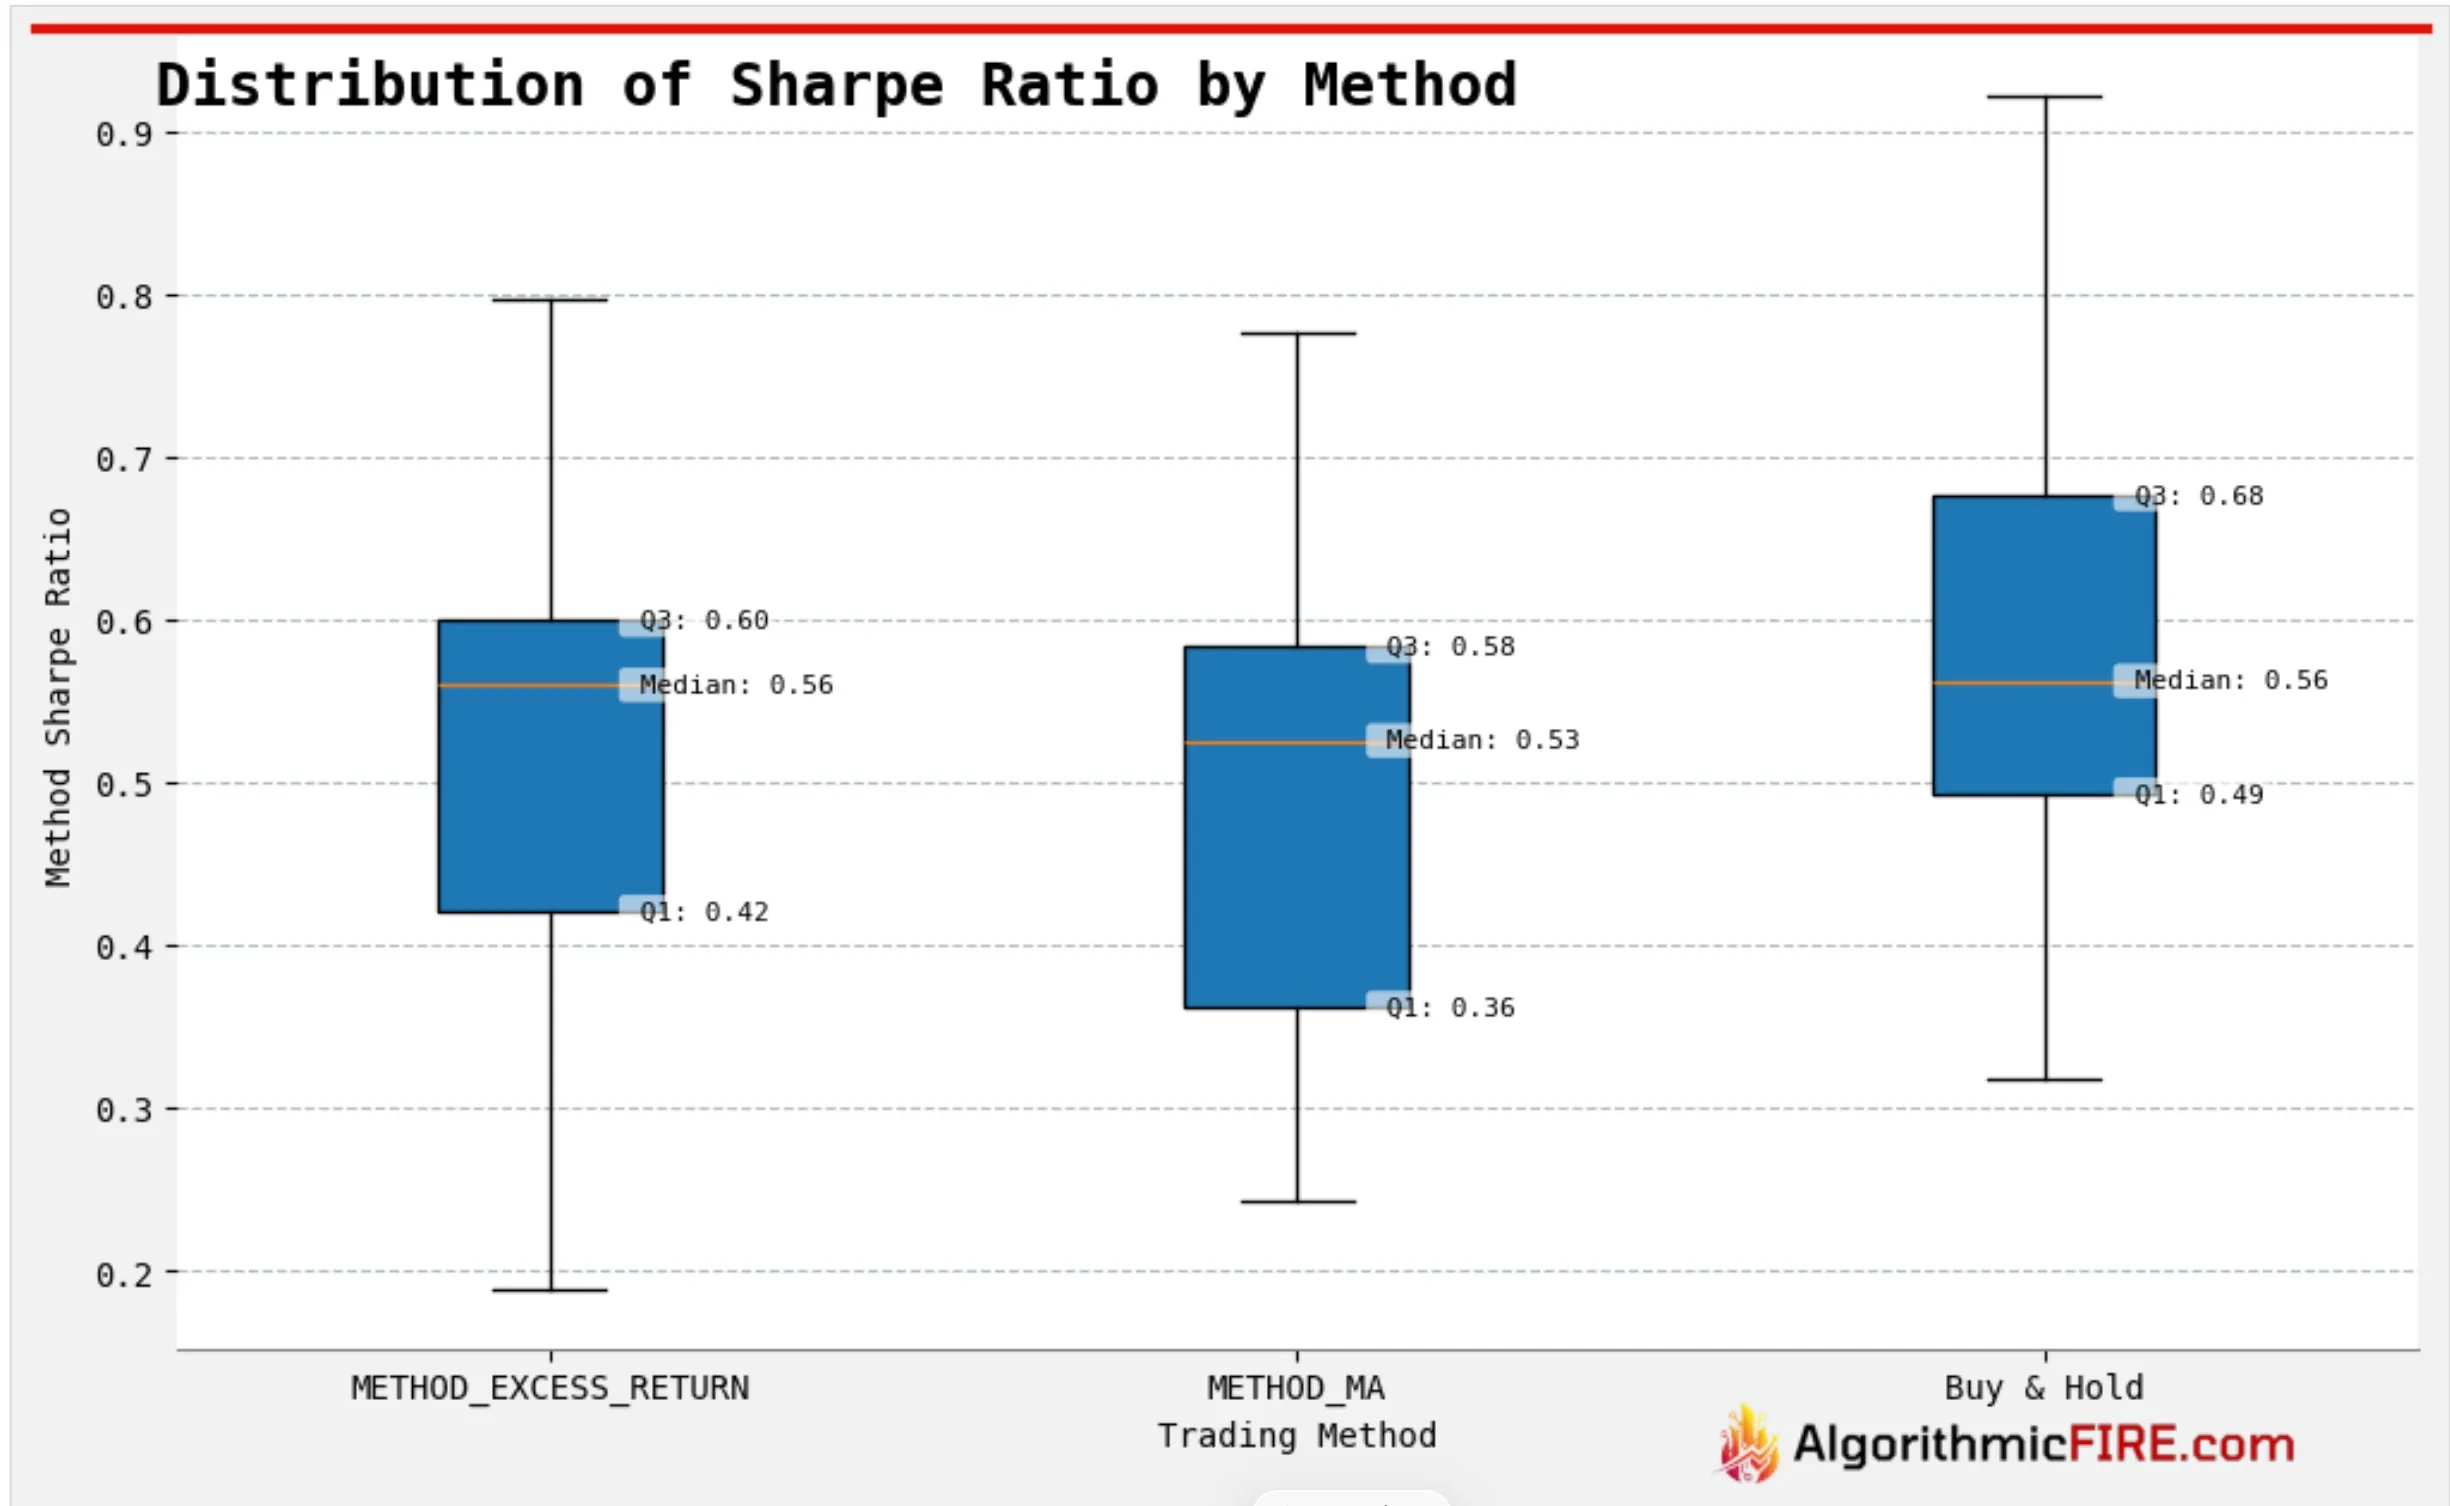
- The advantage seen in the sharpe ratio with no taxes has been eliminated.
- That said, the sharpe ratios are all now quite close, indicating that the loss in CAGR is justifiable considering risk-adjusted returns.
- Reference: Median Sharpe Ratio with zero capital gains taxes
- Excess return strategy: 0.67
- Moving average strategy: 0.65
- Buy and hold: 0.56
Performance - Bond ETFs
We didn’t cover bonds in our prior analysis, but decided to add them for this analysis. We selected the 100 largest bond ETFs (by market capitalization) for this analysis.
Maximum Drawdown
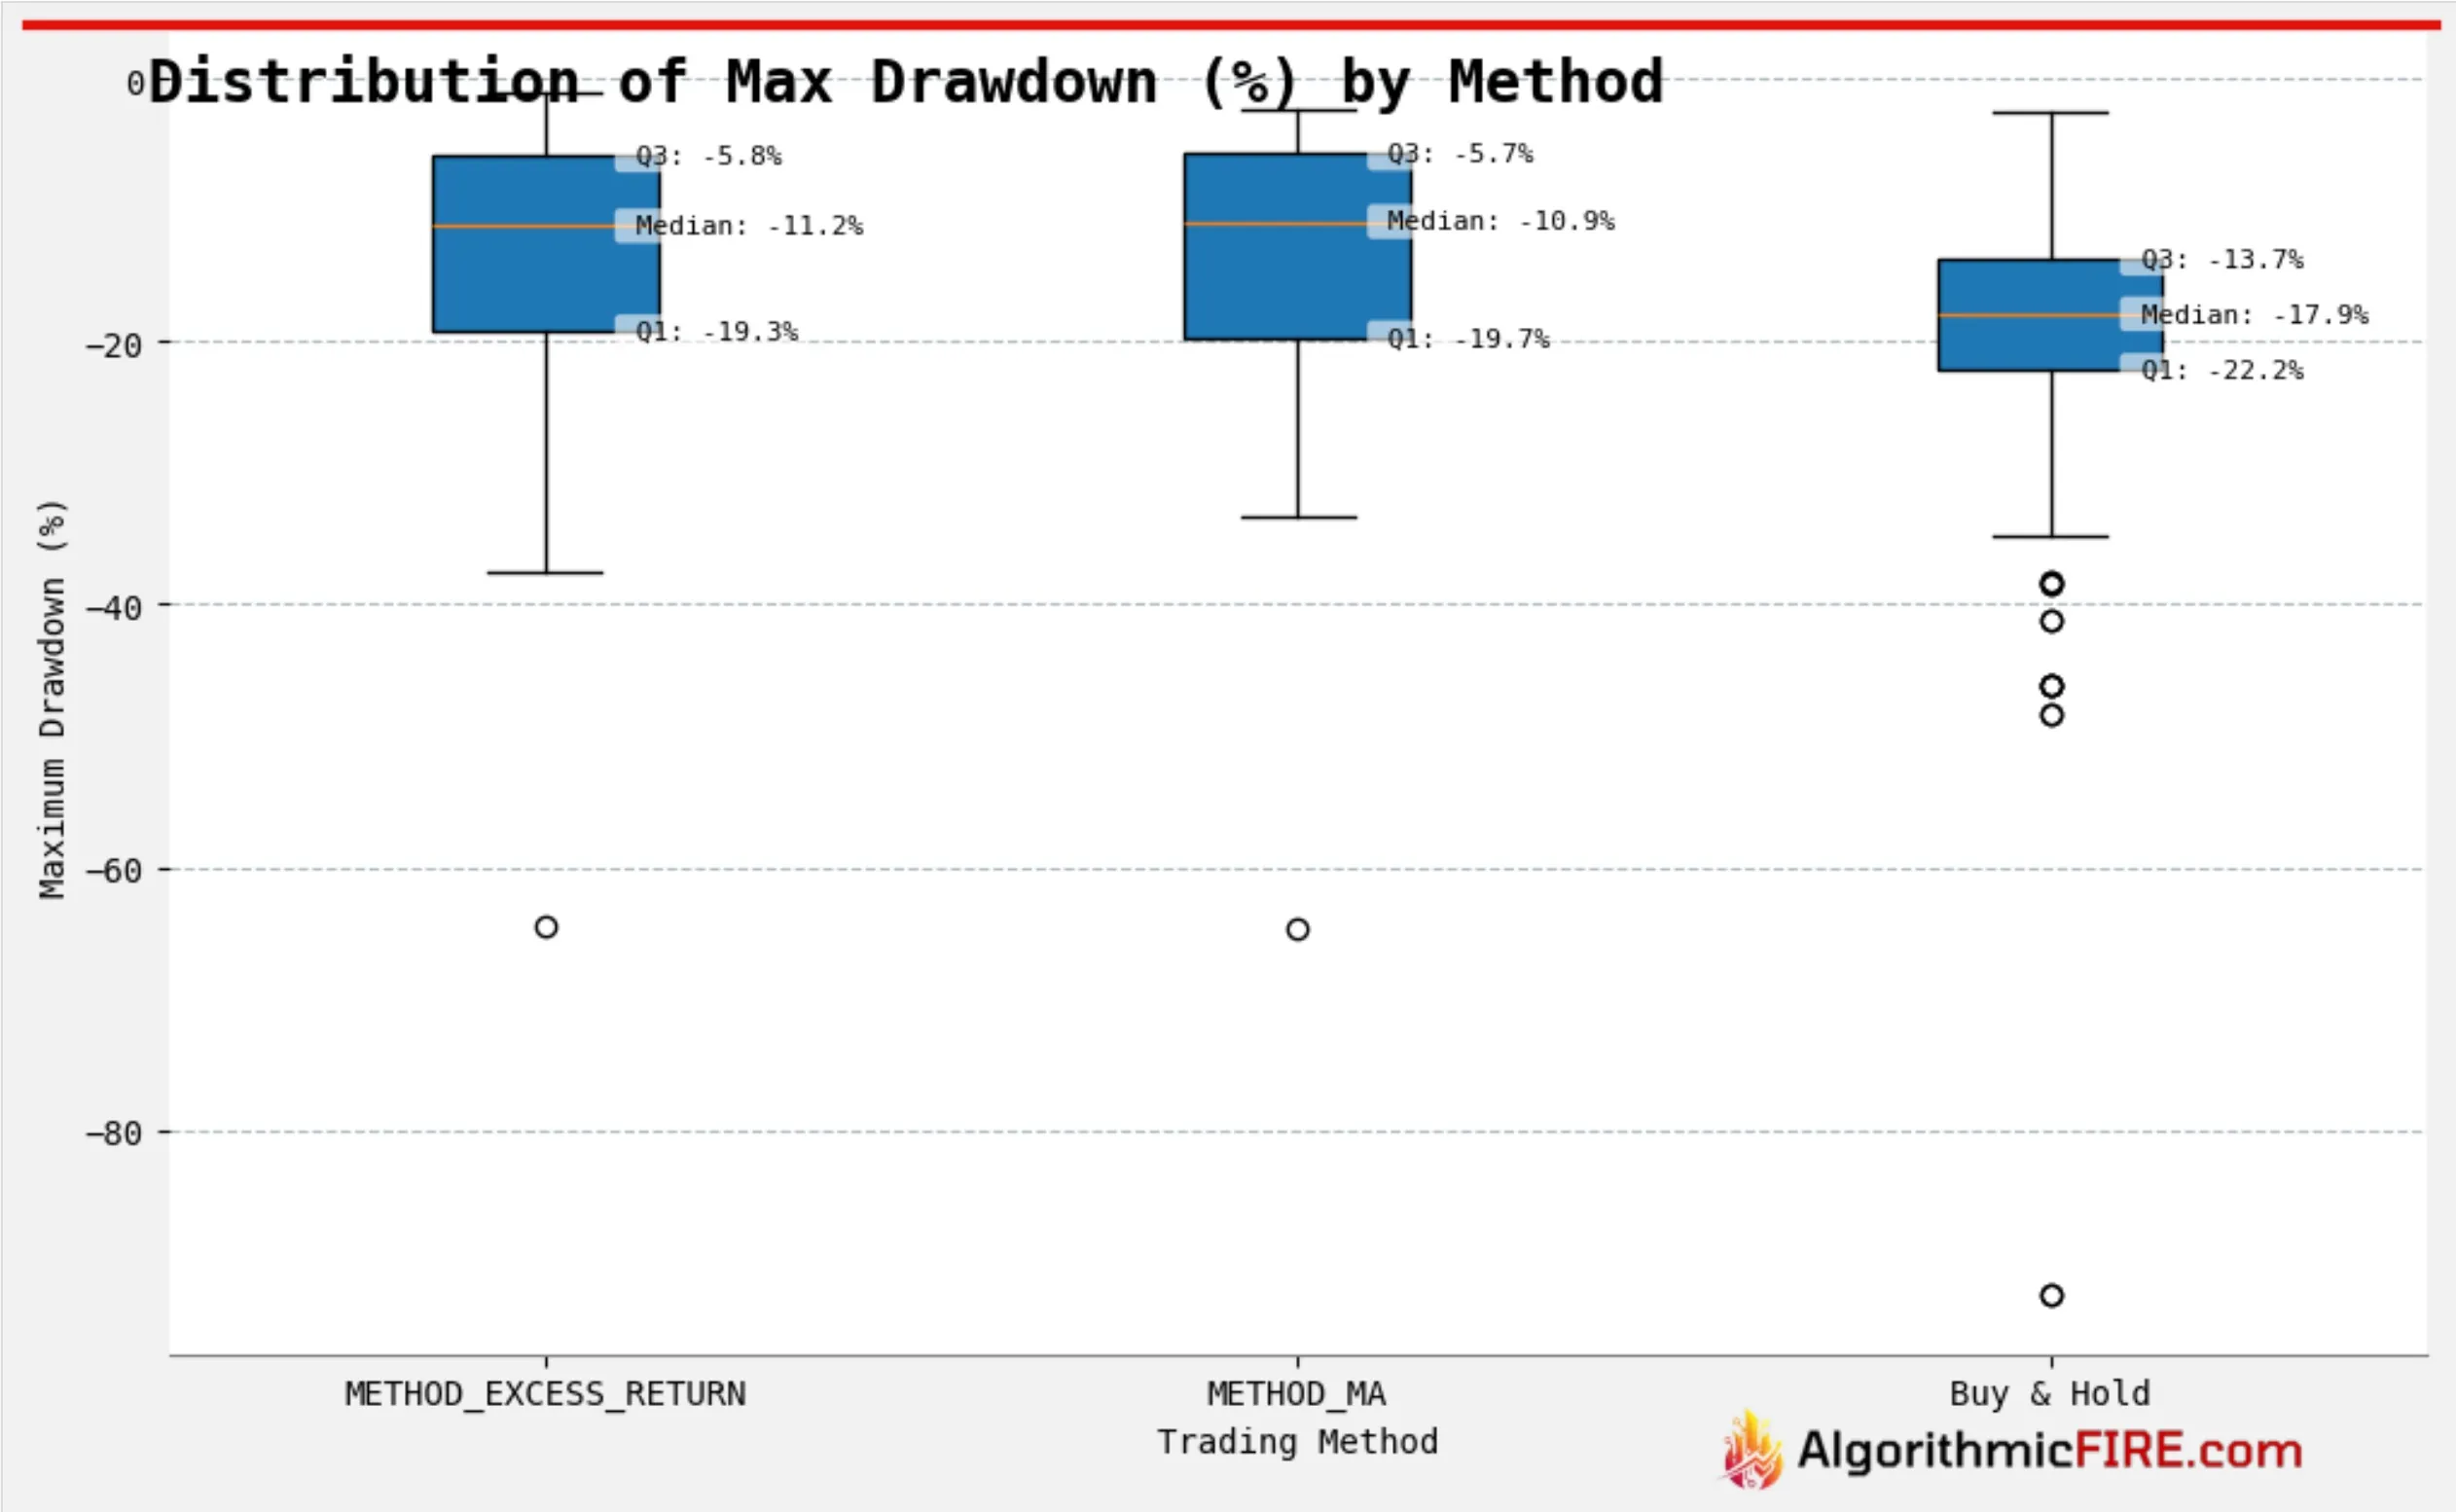
- Median maximum drawdowns are reduced significantly with either trend following strategy, but drawdowns are much less than with stock ETFs.
CAGR
- Median CAGR is better with either trend following strategy than buy-and-hold; substantially better with the Excess Return strategy.
Sharpe Ratio
- Sharpe Ratio for the Excess Returns Strategy is significantly higher than buy-and-hold.
- Sharpe Ratio for the Moving Average Strategy trails buy-and-hold, but not by much.
Takeaways
- Either trend following method, applied to either stock or bond ETFs, maintains a significant drawdown advantage over buy-and-hold.
- Our premise of trend following was that it can be used to reduce drawdowns, at the expense of some CAGR.
- We likened trend following to insurance; the downside protection will cost you a bit of upside.
- CAGR - Stock ETFs
- In a tax advantaged account, the Excess Returns Strategy CAGR with stock ETFs was only 0.1% worse than buy-and-hold.
- With near worst case capital gains tax, the Excess Returns Strategy CAGR is 0.9% worse than buy-and-hold, but the moving average strategy is 2.5% worse than buy-and-hold.
- Thus the downside protection does come at a cost in accounts that are not tax advantaged.
- CAGR - Bond ETFs
- There is no insurance cost; either trend following method does better than buy-and-hold with bond ETFs.
- The Excess Returns Strategy is the better choice of the two trend following methods.
Put Trend-Following to Work: Explore the Live Dashboard
Ready to see how trend-following applies to your own investments? Our live interactive Dashboard updates daily to show you exact buy, sell, and cash-sweep signals for your specific holdings.
Use the dashboard to:
- See Today's Signals: Find out if SPY, QQQ, and 100+ other index and bond ETFs are currently in the market or swept to cash.
- Build a Custom Portfolio: Model your own retirement allocation (e.g., a 60/40 split) and overlay our Excess Return trend models to see how it would have performed historically.
- Compare Strategies: Toggle between SMA, MMA, and Cash Alternative (CA) styles to find the best fit for your risk tolerance.