📌 Summary & Key Takeaways
- Financial Advice Suffers from Rearview-Mirror Optimization: Consensus portfolio advice is rarely predictive; it is reactionary. Wall Street and retail forums systematically engineer portfolios designed to survive the disaster that just concluded, leaving investors exposed to the next emerging shock.
- Static Allocations Always Fight the Prior War: The 1990s tech mania ended with the 2000–2002 Dot-Com bust (-47.52% S&P 500 drawdown). In the 2000–2009 Lost Decade, the S&P 500 lost -8.74% total (-0.91% CAGR) with a -55.19% maximum drawdown, driving investors into the Classic 60/40. The 2008 crash then drove investors into the Permanent Portfolio, which lagged the 2010–2021 bull run by 7.68% per year (7.22% vs. 14.90% CAGR) due to cash and gold drag. In 2022, the Classic 60/40 crashed -15.69% (with a -20.32% drawdown) as stock-bond correlations flipped positive.
- This Decade's Hidden Fire Is Extreme Concentration and Inflation Shocks: Today's consensus of "buy $VOO or $QQQ and chill" is an overfit response to the 2010s tech bull market. With the top 10 stocks making up roughly 37% of the S&P 500 and elevated fiscal deficits destabilizing bond hedges, investors face severe multiple-compression risk.
- Trend Following Is the New Paradigm Because It Adapts to Every Era: Across the full 31.6-year horizon (1995–2026), $100,000 in S&P 500 Dynamic Trend (ER_MMA) grew to $2,894,440 (11.24% CAGR) while holding maximum drawdown to just -19.05% and boosting Sharpe ratio to 0.92. Meanwhile, buy-and-hold reached $2,860,480 (11.20% CAGR) but subjected investors to brutal drawdowns of -47.52%, -55.19%, and -33.72%.
- The Only Guesswork Is What to Put in the Portfolio: Static recipes fail because fixed weights cannot anticipate macro shifts. Dynamic trend following provides the downside defense automatically, leaving only the asset selection to the investor.
When I look back across 50 years of retail personal finance, a striking pattern emerges: almost every "bulletproof" portfolio recommendation was engineered to fight the previous decade's war.
Consensus advice is not forward-looking. It is an overfit patch for yesterday's market trauma. By the time an investment philosophy gets codified into bestselling finance books, endorsed by financial media, and packaged into 401(k) default settings, the macro conditions that created its success are almost always ending.
Retail investors end up buying expensive insurance against a fire that already burned out, leaving their wealth completely exposed to the next blaze.
The 15-Year Adoption Trap
The cycle repeats with remarkable regularity:
Phase 1: Market Trauma
         (1970s stagflation, 2000 tech wreck, 2008 GFC, 2022 bond crash)
            │
            ▼
Phase 2: The Overfit Patch
         Academics & fund managers engineer a portfolio
         tailored to neutralize the disaster that just happened.
            │
            ▼
Phase 3: Institutional Dogma
         Over the next 7 to 10 years, that patch becomes conventional wisdom,
         baked into target-date funds, blogs, and 401(k) defaults.
            │
            ▼
Phase 4: The Adoption Trap
         Retail investors finally adopt the consensus at peak popularity—
         paying top-of-cycle valuation multiples for the last decade's winners.
            │
            ▼
Phase 5: The Macro Shift & Breakdown
         Economic conditions rotate. The new environment strikes the portfolio's blind spot.
         The advice breaks down, generating the next trauma, and restarting the loop.
Here is how this played out across the last five decades:
50 Years of Fighting the Last War
0. The 1970s Prequel: The Stagflation Nightmare
The modern personal finance movement was born out of the stagflation trauma of 1968–1982.
Over that 14-year span (1968–1982), cumulative inflation surged by +186.2% (peaking at 14.8% annually in March 1980). In terms of real returns, the S&P 500 price lost half (-49.6%) of its purchasing power, while the 1973–1974 crash inflicted a devastating -51.95% peak-to-trough real total return drawdown. Cash lost roughly 65% of its real purchasing power.
The Consensus Reaction: "Buy-and-hold investing is dead. Passive capital gets incinerated by inflation. You cannot trust the index."
1. The 1980s: The Star Stock-Picker & Mutual Fund Boom
Coming out of the 1970s, the 401(k) was created (1978/1981), and interest rates peaked at 18% under Paul Volcker.
- The Prescribed Answer: "Hire a star stock-picker to outmaneuver treacherous markets."
- The Darling: Actively managed mutual funds (Peter Lynch's Fidelity Magellan Fund, John Templeton).
- The Blind Spot: Brutal fee drag. Investors gladly paid 1.5% to 2.5% annual expense ratios and front-end "loads" of 5.0% to 8.5% just to purchase shares. When the 1980s and 1990s bull market took flight, investors discovered that over 80% of active stock pickers failed to match the index once high fees were deducted.
2. The 1990s: The Rise of Low-Cost Indexing and ETFs
In response to active management fee gouging, John Bogle's gospel at Vanguard broke into the mainstream. Online brokerages slashed trading commissions, and the first US ETF ($SPY) launched in 1993. Over the 1995–1999 run, the S&P 500 surged +244.45% (28.32% CAGR).
- The Prescribed Answer: "Fire your advisor, buy low-cost index funds, and ride 100% equities."
- The Darling: S&P 500 index funds and tech-heavy mutual funds.
- The Blind Spot: Sequence of returns risk. Investors mistook a once-in-a-generation tech bubble for baseline compounding. The 2000–2002 Dot-Com crash cut the S&P 500 by -47.52% peak-to-trough (and wiped out 78% of the Nasdaq). Anyone who retired in 1999 or 2000 on a 100% stock portfolio watched their retirement plan shatter in its first 36 months.
3. The 2000s: The "Lost Decade" and the 60/40 Dogma
The 2000s delivered a double punch: the Dot-Com crash followed immediately by the 2007–2009 Global Financial Crisis.
Between January 2000 and December 2009, the S&P 500 delivered a total return of -8.74% (an annualized CAGR of -0.91%) with a staggering -55.19% maximum drawdown. Ten full years of equity investing yielded negative nominal wealth.
- The Prescribed Answer: "100% equities is reckless for anyone near retirement. You must hold bonds as an uncorrelated shock absorber."
- The Darling: The Classic 60/40 portfolio and Target Date Funds (cemented as the default 401(k) investment by the 2006 Pension Protection Act).
- The Blind Spot: 60/40 worked brilliantly from 1982 to 2020 because it rode a 40-year bond bull market where 10-year Treasury yields fell from 15% to 0.5%. But during the 2008 GFC, even the Classic 60/40 plunged -34.71%, failing to fully protect retirees. Investors treated negative stock-bond correlation as an immutable physical law rather than an artifact of a disinflationary macro environment.
4. The 2010s: ZIRP, Risk Parity, and Structural Asset Mixes
Following the 2008 crash, central banks lowered rates to zero (ZIRP) and launched quantitative easing. Investors feared runaway currency debasement or another financial collapse.
- The Prescribed Answer: "Bond yields are near zero and 60/40 is broken. You need multi-asset all-weather diversification across stocks, bonds, gold, and cash."
- The Darling: Ray Dalio's All-Weather, Harry Browne's Permanent Portfolio, and Tyler's Golden Butterfly.
- The Blind Spot: Cash and gold drag. While all-weather portfolios protected against a collapse that never materialized, US large-cap tech went on an epic 12-year tear. From 2010 through 2021, the S&P 500 generated a 14.90% CAGR (+428.38% total return). The Permanent Portfolio delivered a 7.22% CAGR (+130.54% total return)—trailing by 7.68% per year. Investors suffered intense performance fatigue watching cash and gold sit idle.
5. The 2020s: The Great 2022 Correlation Shock
In 2022, the 40-year disinflationary environment abruptly ended. Inflation touched 9%, the Federal Reserve hiked interest rates at the fastest pace in four decades, and stocks and bonds plunged simultaneously.
The Classic 60/40 suffered a -15.69% loss in 2022 with a -20.32% drawdown. Bonds provided zero protection; long-term Treasuries dropped more than 30%. It was the worst year for balanced investors since 1937.
What Is This Decade's Fire?
Following the 2022 shock and the subsequent artificial intelligence boom, the pendulum swung hard back to 100% equity indexing: "Bonds are dead, diversification is a drag, just buy $VOO or $QQQ and chill."
If history repeats, what is the blind spot this decade's advice is ignoring?
1. Unprecedented Market-Cap Concentration
The top 10 companies in the S&P 500 now represent approximately 37% of the total index weight—surpassing the 27% peak of the 2000 dot-com bubble.
When you buy an S&P 500 index fund today, you are not buying a broadly diversified slice of corporate America. You are making a heavily concentrated momentum bet on seven mega-cap tech stocks trading at 30× to 35× forward earnings. If enterprise AI capital expenditures slow or multiple compression occurs, the broad index has virtually no diversification buffer.
2. Structurally Higher Inflation & Fiscal Volatility
With US public debt exceeding 120% of GDP and persistent annual budget deficits above $1.5 trillion, the structural tailwinds of 1990–2020 (globalization, peace dividends, falling interest rates) have shifted.
When inflation spikes, stock and bond prices become positively correlated. The assumption that fixed income will automatically shield equity drawdowns is fundamentally broken in a supply-constrained or fiscally loose environment.
31-Year Simulation Results: 1995 to Present
To test how these competing philosophies hold up across changing environments, I ran historical simulations across the full 31.6-year history starting in January 1995 (the inception era of the modern index ETF):
- S&P 500 Buy & Hold ($SPY) – The 1990s and modern 2020s favorite.
- S&P 500 Dynamic Trend (ER_MMA) – Moving-average trend model applied to $SPY.
- Classic 60/40 Buy & Hold – The 2000s balanced dogma (60% SPY / 40% AGG), entering in September 2005.
- Permanent Allocation Portfolio – The 2010s risk-parity darling (25% SPY / 25% TLT / 25% IAU / 25% BIL), entering in May 2009.
To evaluate them fairly on a single dollar chart, portfolios entering after 1995 are normalized to the benchmark equity level on their inception date.
Chart 1: Long-Term Growth of $100,000 (1995–Present)
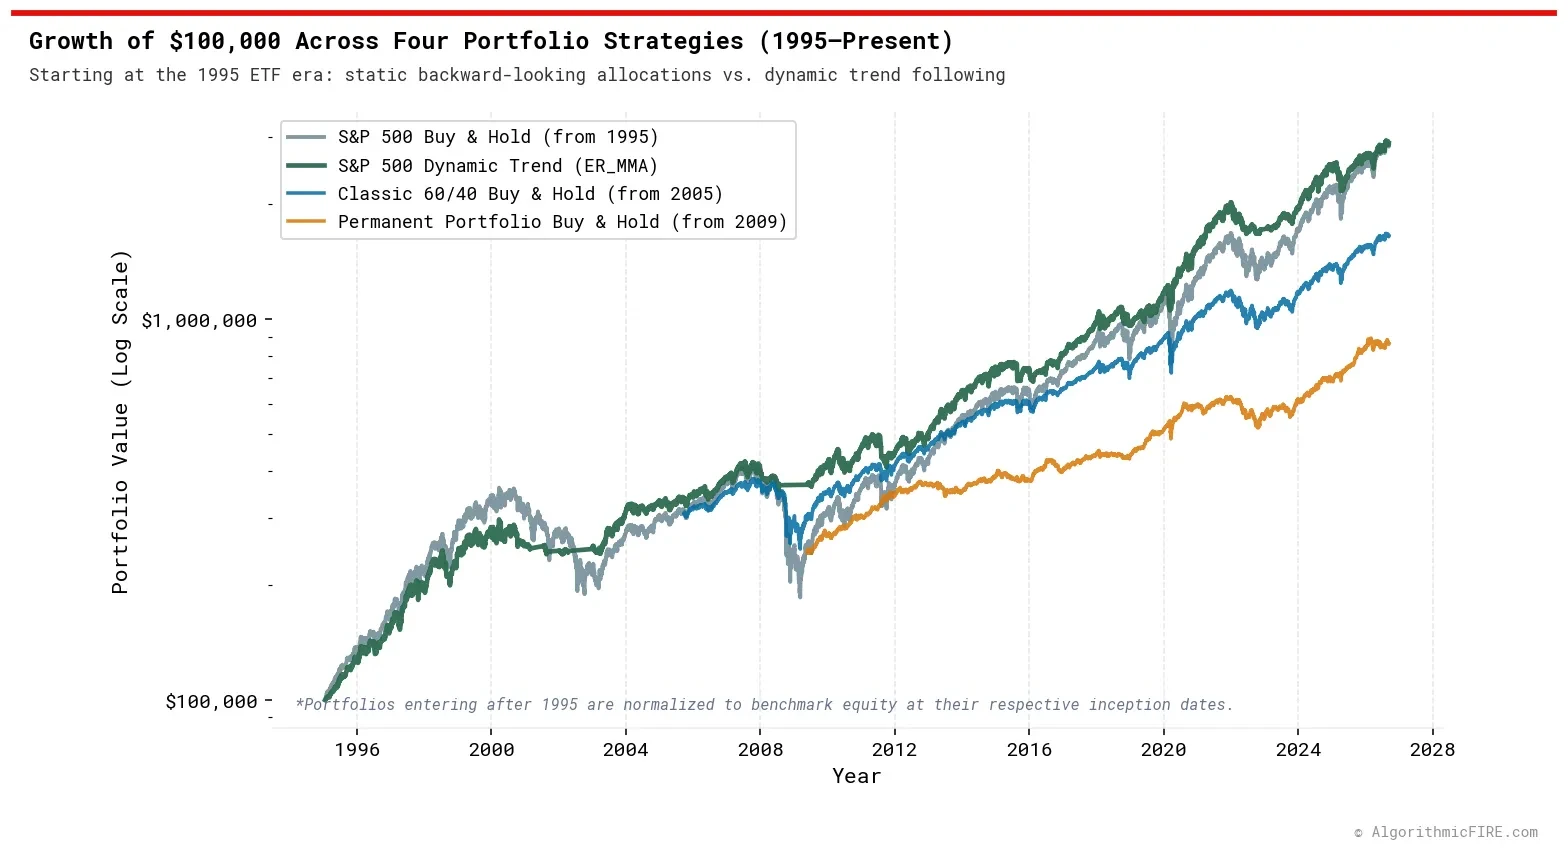
Over the 31.6-year span from January 1995 to September 2026:
- S&P 500 Dynamic Trend (ER_MMA): Turned $100,000 into $2,894,440 (11.24% CAGR). It captured the 1990s bull run, stepped aside during the 2000–2002 Dot-Com crash and the 2008 GFC, participated in the 2010s expansion, and finished with the highest ending wealth of all strategies.
- S&P 500 Buy & Hold: Turned $100,000 into $2,860,480 (11.20% CAGR). While its ending wealth was comparable to trend following, the path was grueling—subjecting investors to two consecutive crashes exceeding 47% and a severe 2020 panic.
- Classic 60/40 Buy & Hold: From its September 2005 entry pegged to benchmark equity ($309,100), it grew to $1,653,098 (8.34% CAGR). The 40% bond allocation cushioned some equity volatility, but delivered substantial performance drag over the long haul.
- Permanent Portfolio Buy & Hold: From its May 2009 entry pegged to benchmark equity ($245,280), it grew to $861,718 (7.54% CAGR). The static 25% allocations to gold and short-term cash alternatives acted as a heavy anchor throughout the decade-long expansion.
Chart 2: Drawdown Profiles Across Major Crashes
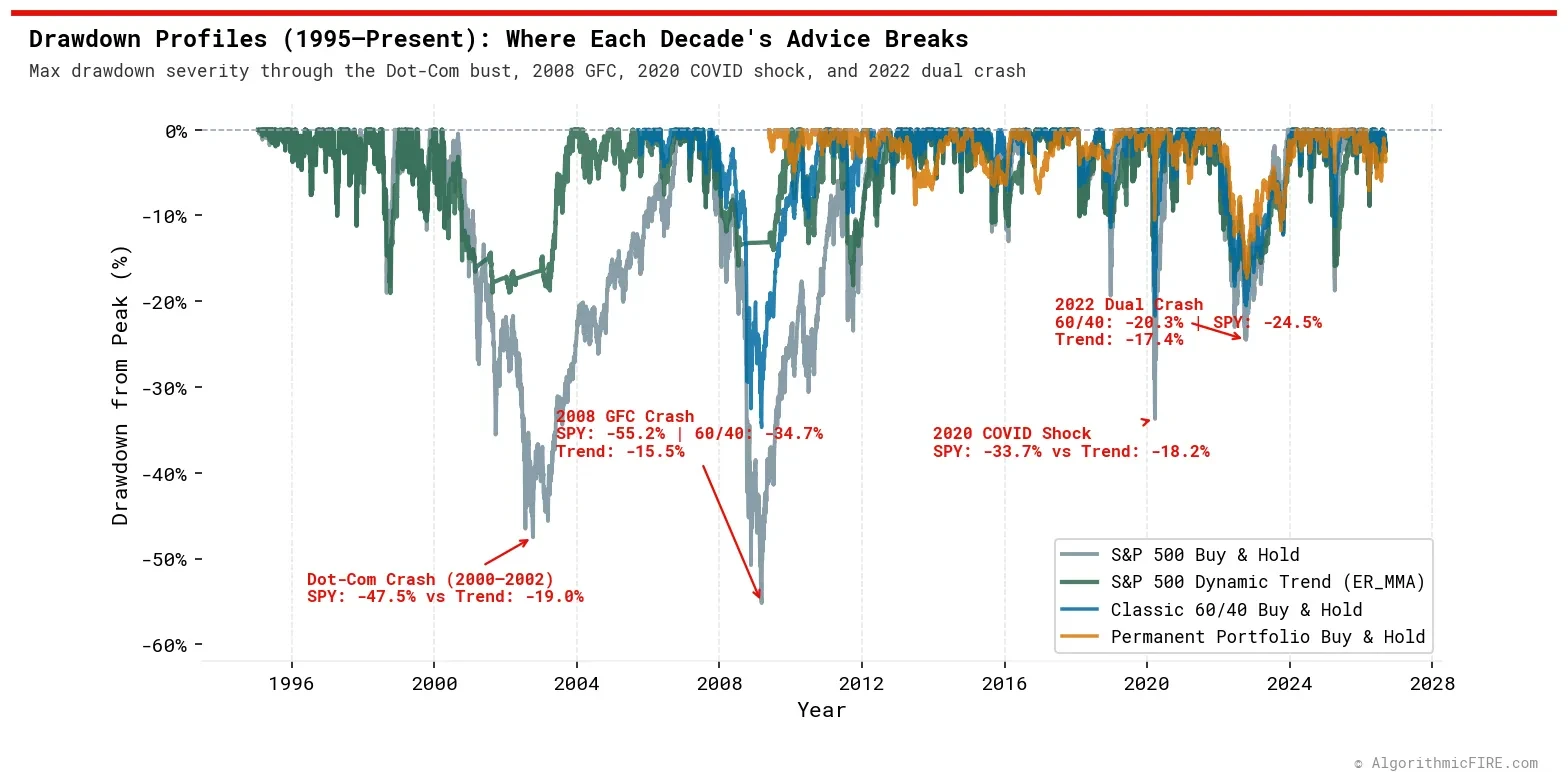
The drawdown profiles reveal where each decade's consensus advice breaks down:
- The Dot-Com Bust (2000–2002): S&P 500 Buy & Hold plunged -47.52% from peak. S&P 500 Dynamic Trend held its maximum drawdown to just -19.00%, moving into cash as momentum broke down.
- The 2008 Global Financial Crisis (2007–2009): S&P 500 Buy & Hold collapsed -55.19%, while the Classic 60/40 dropped -34.71%. In stark contrast, S&P 500 Dynamic Trend held its drawdown to just -15.54%.
- The 2020 COVID Panic: S&P 500 Buy & Hold plummeted -33.72% in five weeks, while trend following contained the drop to -18.16%.
- The 2022 Dual Crash: Bonds failed to cushion equities. Classic 60/40 plunged -20.32%, and S&P 500 Buy & Hold dropped -24.50%. By trimming exposure systematically, trend following held S&P 500 drawdown to -17.35%.
Across the entire 31.6-year timeline, S&P 500 Dynamic Trend never experienced a drawdown worse than -19.05%—less than half the pain of buy-and-hold.
Chart 3: Annualized Returns by Macro Era
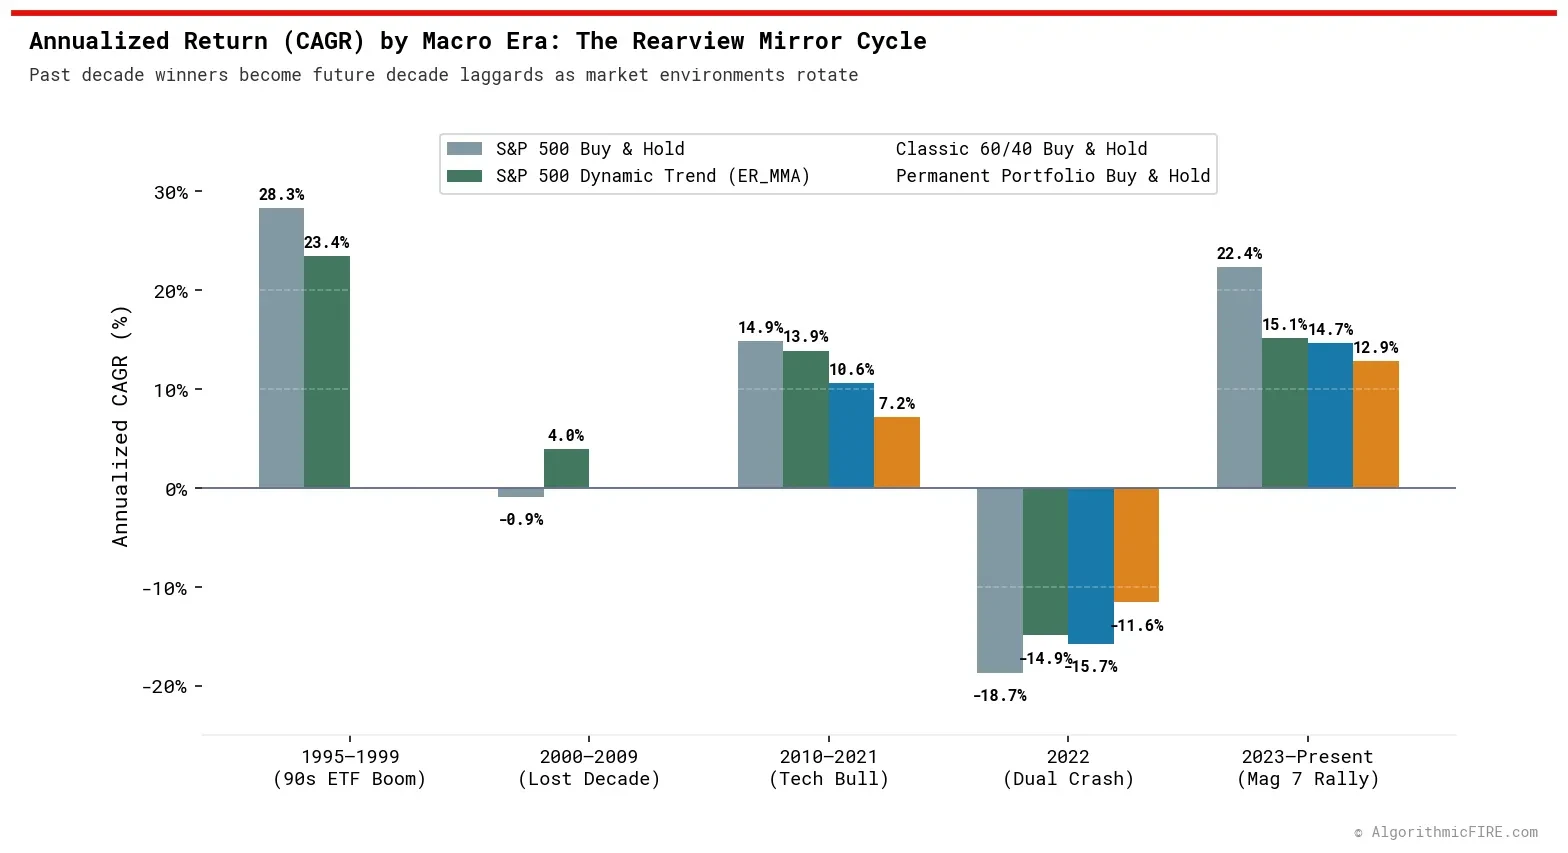
When I break down performance across individual market cycles, the rearview-mirror pattern is glaring:
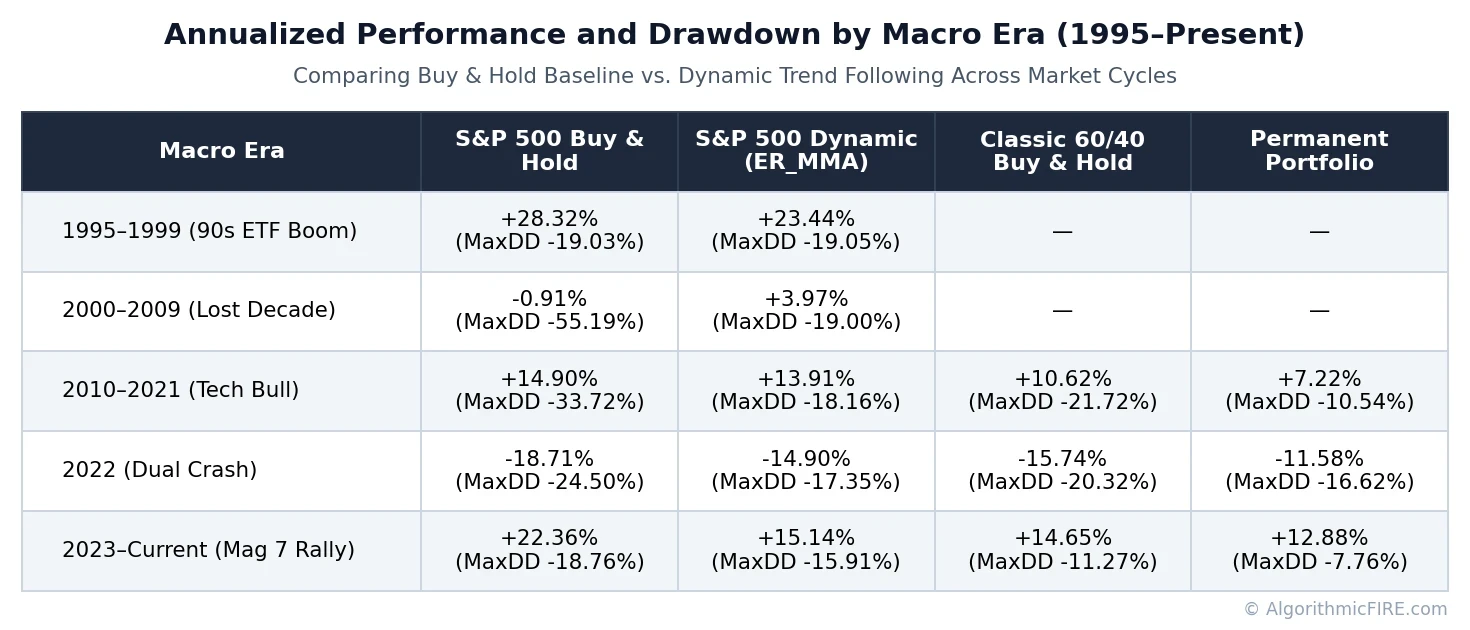
Look at the rotation:
- In the 1990s, 100% equity compounding convinced investors they never needed bonds.
- In the 2000s, two crashes of 47% and 55% devastated 100% equity portfolios (-0.91% CAGR for 10 years), driving investors into the Classic 60/40.
- In the 2010s, 60/40 and All-Weather lagged the tech bull market by hundreds of basis points, driving investors back into 100% tech equities.
- In 2022, 60/40 suffered its worst drawdown in half a century (-20.32%), proving that static bond hedges can fail when inflation strikes.
- Meanwhile, dynamic trend following delivered positive returns during the Lost Decade (+3.97% CAGR), captured the vast majority of the 2010s bull run (+13.91% CAGR), and contained drawdowns under 20% across all 31.6 years.
Why Trend Following Is the New Paradigm
Static asset allocations fail because they are locked into fixed weights designed for the previous disaster. When economic conditions rotate, those static weights become an anchor.
Trend following represents a different investing paradigm: it always works because it adapts to price reality rather than forecasting macroeconomic shifts.
1. It Solves the Sequence-of-Returns Problem Dynamically
In retirement planning, the biggest threat is not inflation or low yields; it is the sequence of returns risk from a 40% to 55% market crash in the first decade of decumulation.
Static portfolios try to solve this by permanently holding low-return assets (cash, gold, aggregate bonds). You pay for crash protection every single year in the form of lower compounding.
Dynamic trend following provides downside defense only when prices are actually falling:
- When an asset is in an established uptrend, the strategy maintains full equity exposure.
- When the trend breaks down, the strategy systematically steps aside into risk-free cash alternatives.
You keep the growth engine running during decade-long bull markets, and receive the downside hedge exactly when the crisis occurs.
2. "The Only Guesswork Is What to Put in the Portfolio"
With static allocations, the investor has to guess:
- Will inflation be high or low over the next 20 years?
- Will stock-bond correlations stay negative or turn positive?
- Will international equities finally outperform US large-caps?
If you guess wrong on static weights, you either get caught in a 55% drawdown (like 2008) or suffer decade-long drag (like the Permanent Portfolio in the 2010s).
With trend following, that guesswork disappears. The trend rules manage the exposure and drawdown risk dynamically. The only choice left for the investor is deciding what high-quality assets to include in the investable universe—whether that is broad US equities ($SPY), large-cap tech ($QQQ), or a multi-sleeve balanced core.
Final Thoughts
The next time financial media or social forums tell you that a specific portfolio architecture is the only rational way to invest, ask yourself a simple question:
Is this strategy designed for the future, or is it just the perfect hedge against the disaster from five years ago?
Stop buying insurance against yesterday's fire. Build a portfolio that adapts to market reality as it unfolds.