šŸŽ‰
Summer Launch Special: Get 1 month free. Use code SUMMER_2026_1_MONTH at checkout.

Understanding Sequence of Returns Risk

A critical risk factor that can make or break your retirement portfolio, regardless of average returns

šŸ“Œ Summary & Key Takeaways

  • Return Order Matters More Than Return Average: Two portfolios with identical average returns produce dramatically different outcomes depending on whether drawdowns occur early or late. In my simulation of two $1,000,000 portfolios taking $100,000 annual withdrawals, an early -50% loss leaves a final balance of $100,000, while an early +100% gain leaves $700,000 — a $600,000 terminal wealth gap with zero difference in average market returns.
  • Early Drawdowns Permanently Destroy Capital Base: A 50% crash in Year 1 combined with a $100,000 withdrawal immediately shrinks a $1,000,000 portfolio to $400,000 after withdrawal. Subsequent annual withdrawals continue to drain this depleted base, leaving less capital to compound when market recoveries occur.
  • Sequence Risk Is Asymmetric and Front-Loaded: Sequence of Returns Risk (SRR) is concentrated in the first 5 to 10 years of retirement. Surviving this initial window without severe drawdown preserves long-term portfolio longevity, which is why I design defensive overlays (trend-following, cash buffers, variable withdrawal rates) specifically for early retirement transitions.

When I analyze portfolio longevity in early retirement, the single most destructive threat to a retiree's nest egg is not low average market returns — it is Sequence of Returns Risk (SRR).

In this post, I explain the mathematical mechanics of SRR and demonstrate how early portfolio drawdowns lock in capital losses during decumulation.

What Is Sequence of Returns Risk?

Sequence of Returns Risk is the danger that severe market drawdowns occurring early in retirement will permanently deplete your capital base before compound growth can recover.

šŸ’” Explore the Math: Read my companion guide on Safe Withdrawal Rates or model return sequences directly using my interactive Sequence of Returns Calculator.

During accumulation, the sequence of annual returns does not change your final wealth. But once you begin taking annual withdrawals, the order of returns becomes critical:

  • Early losses permanently shrink the asset base used to create future growth.
  • Withdrawals taken during drawdowns lock in capital losses, preventing those dollars from participating in subsequent market recoveries.
  • The risk is heavily front-loaded: Market performance in the first 5 to 10 years of decumulation dictates long-term survival.

To illustrate this asymmetry, I modeled two $1,000,000 portfolio scenarios subject to $100,000 annual withdrawals over a 5-year period.


Scenario 1: The Early Loss Trap

In my first simulation, the portfolio suffers an immediate -50% loss in Year 1, experiences zero growth in Years 2 through 4, and rebounds with a +100% gain in Year 5.
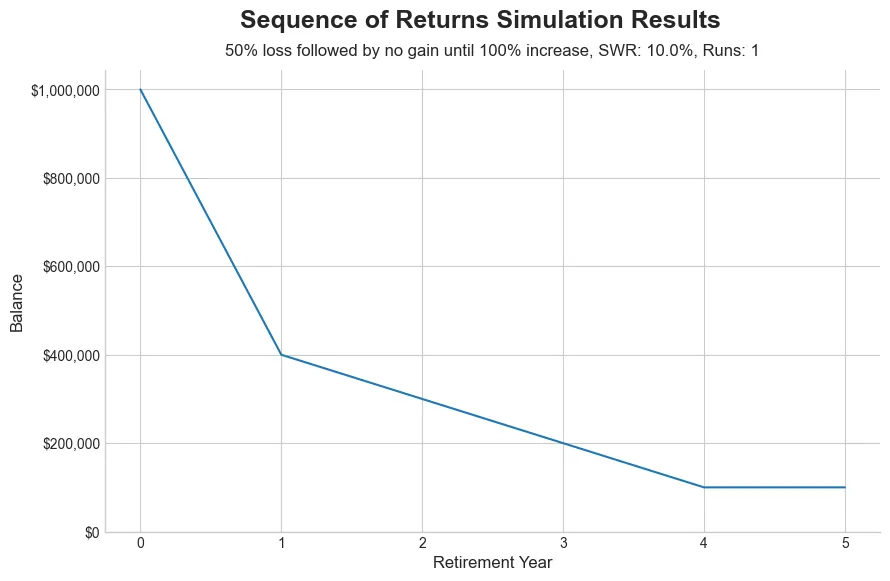
Bar chart illustrating portfolio balance decline under an early 50 percent loss and $100k annual withdrawals.
Sequence of Returns Risk: Early Loss Scenario: An early 50% loss followed by four years of zero or positive returns rapidly depletes capital ($1,000,000 to $400,000 after year 1), leaving the portfolio at $700,000 after 5 years despite a +100% final year surge.

Simulation Parameters & Year-by-Year Math

  • Initial Capital: $1,000,000
  • Annual Withdrawal: $100,000 (taken at year-end post-growth)
  • Year 1 (-50% Return): $1,000,000 * 0.50 = $500,000. Less $100,000 withdrawal -> $400,000
  • Year 2 (0% Return): $400,000 * 1.00 = $400,000. Less $100,000 withdrawal -> $300,000
  • Year 3 (0% Return): $300,000 * 1.00 = $300,000. Less $100,000 withdrawal -> $200,000
  • Year 4 (0% Return): $200,000 * 1.00 = $200,000. Less $100,000 withdrawal -> $100,000
  • Year 5 (+100% Return): $100,000 * 2.00 = $200,000. Less $100,000 withdrawal -> $100,000

Key Insight: Even though the market delivered a massive +100% gain in Year 5, the portfolio ended at just $100,000. Taking withdrawals from a crash-depleted base locked in early losses and starved the portfolio of capital during the recovery.


Scenario 2: The Early Gain Buffer

In my second simulation, I reversed the return sequence: a +100% gain in Year 1, 0% growth in Years 2 through 4, and a -50% loss in Year 5.
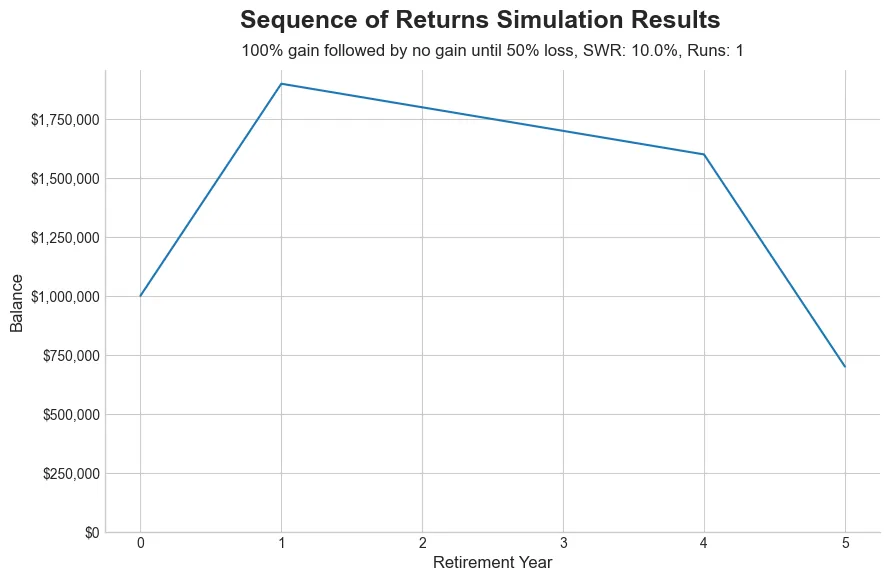
Bar chart illustrating portfolio balance growth under an early 100 percent gain before experiencing a late loss.
Sequence of Returns Risk: Early Gain Scenario: An early +100% gain expands principal to $1,800,000 after withdrawals, allowing the portfolio to absorb a late -50% loss and finish at $700,000.

Simulation Parameters & Year-by-Year Math

  • Initial Capital: $1,000,000
  • Annual Withdrawal: $100,000
  • Year 1 (+100% Return): $1,000,000 * 2.00 = $2,000,000. Less $100,000 withdrawal -> $1,900,000
  • Year 2 (0% Return): $1,900,000 * 1.00 = $1,900,000. Less $100,000 withdrawal -> $1,800,000
  • Year 3 (0% Return): $1,800,000 * 1.00 = $1,800,000. Less $100,000 withdrawal -> $1,700,000
  • Year 4 (0% Return): $1,700,000 * 1.00 = $1,700,000. Less $100,000 withdrawal -> $1,600,000
  • Year 5 (-50% Return): $1,600,000 * 0.50 = $800,000. Less $100,000 withdrawal -> $700,000

Key Insight: With an early gain, the portfolio ended at $700,000. The initial return spike built an asset buffer, allowing annual withdrawals to represent a smaller percentage of total wealth before the drawdown hit.


Comparative Analysis: The $600,000 Sequence Gap

Across both simulations:

  • Both portfolios started with $1,000,000.
  • Both portfolios experienced identical cumulative market returns (0% net cumulative return).
  • Both portfolios distributed identical total income ($500,000 over 5 years).

Volatility Drag vs. Sequence Risk: Understanding the Difference

It is essential to distinguish between Volatility Drag and Sequence of Returns Risk:

  1. Volatility Drag (Symmetric Math):

    • Volatility drag reduces compound geometric returns (\(g \approx \mu - \frac{\sigma^2}{2}\)) across all portfolios, with or without withdrawals.
    • However, during accumulation with zero cash flows, sequence does not matter: $100 × 0.50 × 2.00 = $100 produces the identical ending balance as $100 × 2.00 × 0.50 = $100.
  2. Sequence Risk (Asymmetric Decumulation):

    • Once you begin withdrawing living expenses, the symmetry breaks completely.
    • Withdrawing money during early drawdowns liquidates shares at bottom prices. Those liquidated shares are no longer in the account to catch the subsequent recovery factor, leading directly to the $600,000 sequence gap demonstrated above.

Key Takeaways

  1. Timing Trumps Average Returns: In decumulation, average returns are a misleading metric. Managing the sequence of returns is far more important for portfolio survival.
  2. Protect the Fragile Window: The first 5 to 10 years of retirement require explicit downside mitigation to avoid locking in catastrophic early losses.
  3. Deploy Structural Defense: To protect against Sequence Risk, I advocate combining dynamic asset allocation, cash flow buffers, and mechanical trend-following overlays to cap drawdowns during early retirement.

Watch the Video Summary

Prefer video format? Watch the summary on our dedicated player page (5:32).

Watch Video Summary →

Frequently Asked Questions

Sequence of returns risk is the danger that the timing of market withdrawals will severely damage your overall portfolio value. If you experience negative market returns early in retirement while simultaneously withdrawing living expenses, your portfolio balance drops rapidly. This makes it mathematically very difficult to recover, even if average returns over your lifetime are excellent.

Consider two retirees, Alice and Bob. Both average a 7% return over 30 years and withdraw $50,000 annually. Alice experiences a severe market crash in her first three years of retirement, while Bob experiences the exact same crash in his final three years. Because Alice's portfolio balance was heavily depleted early on while taking withdrawals, she runs out of money by year 20. Bob's portfolio, having grown for decades before the crash, easily survives. This is sequence of returns risk.

Sequential risk is another term for sequence of returns risk. It highlights that the specific order (or sequence) of investment returns matters significantly more during the distribution phase (retirement) than during the accumulation phase (saving).

Continue Your Research


Thanks for reading! Feel free to share this post, and follow us on social media:

X Yahoo Finance Share
Paul Dunn Profile
Written by Paul Dunn

Founder & Lead Engineer at AlgorithmicFIRE

Paul Dunn applies software engineering and data analysis principles to retirement planning. As a data engineer, he designs quantitative simulators (Monte Carlo, SWR sweep, tax optimizers) to verify portfolio longevity against historical and statistical cycles.


View Video Transcript

All right. When you're planning for retirement, what's the one number we're all taught to focus on? That big, beautiful average annual return, right? But what if I told you that number can be a bit of a trap? There's a hidden danger, especially right when you stop working, where that average can be seriously misleading. So, let's break down what this risk is and more importantly, how it actually works. So, let's put a name to this thing. We're talking about a critical factor in retirement planning called the sequence of returns risk. I know it's a wild idea, isn't it? We spend our entire careers trying to get the highest possible average return. But for retirees, it turns out that when you get your returns can be just as important as what those returns are, maybe even more so. So, here's the deal in a nutshell. Sequence of returns risk is the danger that a big market crash right at the start of your retirement could have a devastating long-term impact. And why is that? Because you're not just saving anymore. You're actively pulling money out to live on. And that one change makes all the difference. Let's see how this plays out in the real world. To really see this thing in action, let's walk through our first scenario. We'll call this one a bad start. Here's the setup. A retiree starts off in a great spot. A million in the bank. The plan is to withdraw $100,000 every year. Now, pay really close attention to these market returns. It's a nasty 50% drop in year 1, then a few years of going nowhere, followed by a massive 100% gain in the final year. So, year zero, we start with a million dollar nest egg. Everything's looking good. But then boom, disaster strikes in year one. The market gets cut in half. So that million-doll portfolio is suddenly worth just 500,000. And from that, our retirees still has to take out their hundred grand to live on. That leaves them with just $400,000 after a single year. That is a massive, massive blow. For the next few years, the market is totally flat. But those annual withdrawals just keep coming out, eating away at that smaller pile of money. By the time you get to the end of year four, the portfolio has just dwindled down to $100,000. And here's the full picture. You see that huge 100% gain at the very end. You'd think that would save the day, but it's too little too late. Doubling $100,000 only gets you back to 200,000. The portfolio never recovers because that initial loss combined with the withdrawals was just catastrophic. Okay, now let's look at scenario two. A good start. This retiree has the exact same starting money, the same average returns. We're just flipping the order. See what we did? We just inverted the returns. This time, our retiree gets that incredible 100% gain in their very first year. Then come the flight years, and that awful 50% loss happens at the very end. And the result is explosive. The $1 million portfolio doubles to 2 million bucks. a retiree takes out their $100,000 and they're still left with an incredible 1.9 million. I mean, that's just a world of difference. This chart for this scenario tells a completely different story. That huge gain right at the start creates such a large cushion that the portfolio can easily handle the withdrawals later on. And even that 50% drop at the end. Instead of running out of money, this retiree ends with a really healthy balance of well over half a million dollars. So, what is going on here? Same amount of money, same withdrawals, same average returns over the long run. Why are the outcomes so wildly different? Looking at them side by side really just drives the point home, doesn't it? On the left, you've got financial ruin. On the right, a comfortable retirement. The only thing that changed was the sequence, the order of those market returns. Okay, here's the critical difference. If you were still working and just buying and holding investments, the order wouldn't matter. A 50% drop followed by a 100% gain gets you right back where you started. But when you were a retiree, you have to sell assets to generate income. In that bad first scenario, you're forced to sell when your assets are worth half as much. You're selling low. This locks in your losses permanently and means you have way less capital left to benefit from the recovery when it eventually comes. So, does this mean your retirement is just a matter of dumb luck? Not at all. The good news is there are concrete strategies you can use to protect your portfolio from this very risk. It's the most important question, isn't it? How do you defend yourself against a bad sequence of returns that you can't possibly predict? While the key is to reduce the wild swings in your portfolio, the volatility. While stocks are great for long-term growth, other assets like bonds or gold often move differently and they can act as a buffer when the stock market is tanking. By holding a diversified mix, you have more stable things you can sell for income when your stocks are down. That gives your stocks time to recover, and it helps you avoid selling them at the absolute worst time. And that brings us to the single most important idea to take away from all of this. We hear it all the time, don't try to time the market. And that's true. But what this risk shows is that ready or not, the market might just time you. The market's performance in your first few years of retirement can have a massive outsized impact on the rest of your life. And just understanding that that's the first and most important step to preparing for it.

Disclaimer

For Educational Purposes Only: All content on this site, including articles, tools, and simulations, is for informational and educational purposes only. It should not be construed as financial, investment, legal, or tax advice. The information provided is general in nature and not tailored to any individual's specific circumstances.

Software Development & Data Processing Risks: The software used to perform the analyses may have errors or inaccuracies. When we post updates to any material, errors or inaccuracies that are subsequently fixed may change the results. Historical pricing revisions, corporate actions, or algorithmic optimizations may dynamically recalculate past simulation timelines. As a result, past signal sequences shown on this site or in digests may shift retroactively to align with the revised data.

No Guarantees & Risk of Loss: The analyses and simulations presented are based on historical data. Past performance is not an indicator or guarantee of future results. All investing involves risk, including the possible loss of principal. Market conditions are subject to change, and the future may not resemble the past.

No Fiduciary Relationship: Your use of this information does not create a fiduciary or professional advisory relationship. We are not acting as your financial advisor.

Consult a Professional: You should always conduct your own research and due diligence. Before making any financial decisions, it is essential to consult with a qualified and licensed financial professional who can assess your individual situation and objectives. We disclaim any liability for actions taken or not taken based on the content of this site.

Data Sources & Attribution: This site utilizes the FREDĀ® API provided by the Federal Reserve Bank of St. Louis. This product uses the FREDĀ® API but is not endorsed or certified by the Federal Reserve Bank of St. Louis. All FREDĀ® data is used strictly for internal analytical processing and research.

Third-Party Links & Endorsement: This site contains links to third-party websites and resources for your convenience. We have no control over the content, privacy policies, or practices of these sites. The inclusion of any link does not imply endorsement, sponsorship, or recommendation by Algorithmic Fire LLC. We are not affiliated with any third-party sources unless explicitly stated, and we disclaim any liability for information or services provided on these external platforms.

Regulatory Status: Algorithmic Fire LLC is not a registered investment adviser, broker-dealer, or financial planner, and is not affiliated with the Securities and Exchange Commission (SEC) or the Financial Industry Regulatory Authority (FINRA). The content, tools, and simulations provided on this site do not constitute, and should not be construed as, professional financial advisory services.

Copyright 2025-2026 Algorithmic Fire LLC. All rights reserved.