The 2026 IPO pipeline contains the largest combined private-to-public capital transition in market history by a wide margin. SpaceX alone is targeting a valuation that would make it one of the five largest companies on Earth the moment it begins trading. OpenAI and Anthropic are not far behind. When these companies go public, the mechanical plumbing of passive investing — the index funds that now control the majority of U.S. equity assets — will be forced to act. The question is whether that forced action creates a meaningful headwind for the stocks you already own.
This is not a question of opinion. It is a question of arithmetic.
Financial media has covered the individual pieces of this story — the scale of the SpaceX IPO, the mechanics of index rebalancing, and the academic research behind the Inelastic Markets Hypothesis — but as of this writing, nobody appears to have connected all three into a single quantitative analysis. The forced selling math, the compressed inclusion timelines, and the Gabaix-Koijen flow multiplier each tell part of the story. This post runs the numbers end-to-end.
Why Index Funds Have to Sell
If you own a total market index fund, an S&P 500 fund, or a Nasdaq-100 ETF, your fund manager does not choose what to buy. The index provider — S&P Dow Jones Indices, Nasdaq, FTSE Russell — dictates the composition. When a new company is added to the index, the fund must purchase shares of that company in proportion to its weight. And because index funds are fully invested (they hold near-zero cash), the only way to raise the capital for that purchase is to sell existing holdings.
This is not a strategic decision. It is a structural obligation. A fund that fails to rebalance would begin to deviate from its benchmark — accumulating "tracking error" — which is the one thing an index fund is designed to never do. [^1]
The mechanics work as follows:
- The index provider announces an addition (typically 5 trading days before the effective date). [^1]
- Fund managers calculate the required weight based on the new company's float-adjusted market capitalization.
- Managers sell a pro-rata slice of every existing holding to raise the necessary cash.
- The new shares are purchased, usually concentrated around the close of trading on the effective date.
The result is a brief but intense period of broad-based selling pressure across hundreds of existing index constituents, paired with concentrated buying pressure in the newly added stock. When Tesla was added to the S&P 500 in December 2020, index funds needed to purchase an estimated $78–$94 billion of Tesla shares in a single session, generating roughly $148 billion in total trading volume on December 18th alone. [^2] [^3]
That was one company. We are now looking at a pipeline of three to five, all much larger than Tesla was at the time of its IPO.
The Scale of Passive Capital at Stake
To understand the magnitude of the coming rebalancing, you first need to understand how much capital is structurally bound to follow these index rules.
Assets Tracking the S&P 500
The S&P 500 is the most widely tracked index in the world. As of May 2026, the major funds alone represent trillions in structurally obligated capital:
| Fund | Ticker | AUM (May 2026) |
|---|---|---|
| Vanguard 500 Index Fund (Admiral) | VFIAX | ~$1.40 Trillion |
| Vanguard S&P 500 ETF | VOO | ~$956 Billion |
| iShares Core S&P 500 ETF | IVV | ~$826 Billion |
| SPDR S&P 500 ETF Trust | SPY | ~$770 Billion |
| Fidelity 500 Index Fund | FXAIX | ~$792 Billion |
Sources: Vanguard, iShares, State Street, Fidelity fund pages (May 2026). [^4]
These are just the five largest individual vehicles. When you include all mutual funds, ETFs, managed mandates, and separately managed accounts that track the S&P 500, the total assets benchmarked to this single index exceed $12 trillion. [^4]
The broader passive fund universe — covering all indexed mutual funds and ETFs in the U.S. — reached $19.09 trillion as of March 2026, according to the Investment Company Institute. This figure now exceeds the $16 trillion held in actively managed funds. [^5]
Total S&P 500 Market Capitalization
As of December 31, 2025, the aggregate market capitalization of the S&P 500 stood at approximately $61.1 trillion. [^4] With the top 10 holdings alone accounting for roughly $25.3 trillion by April 2026, the index is heavily concentrated at the top — which means any new mega-cap entrant will command a disproportionately large weight and therefore a disproportionately large forced purchase.
The Market Cap of the Upcoming IPOs
Here is what the current pipeline looks like, ranked by expected valuation:
| Company | Sector | Est. Valuation | Est. Capital Raise | Status |
|---|---|---|---|---|
| SpaceX / SpaceXAI | Aerospace / AI | $1.75T – $2.0T | $50B – $75B | S-1 filed (confidential, Apr 2026). Target listing: June 12, 2026. [^6] |
| OpenAI | AI / Software | ~$852B (last round) | TBD | Restructured to PBC (Oct 2025). IPO speculated Q4 2026 or 2027. [^7] |
| Anthropic | AI / Software | $380B (Series G, Feb 2026); secondary market ~$900B–$950B | ~$60B (est.) | No S-1 filed. Speculated Q4 2026. [^8] |
| Stripe | Fintech | $159B (Feb 2026 tender offer) | N/A | No IPO announced. Leadership has said they are "in no rush." [^9] |
| Databricks | Data / AI | $134B (Feb 2026 funding) | TBD | CEO says "IPO-ready" but timing fluid. [^10] |
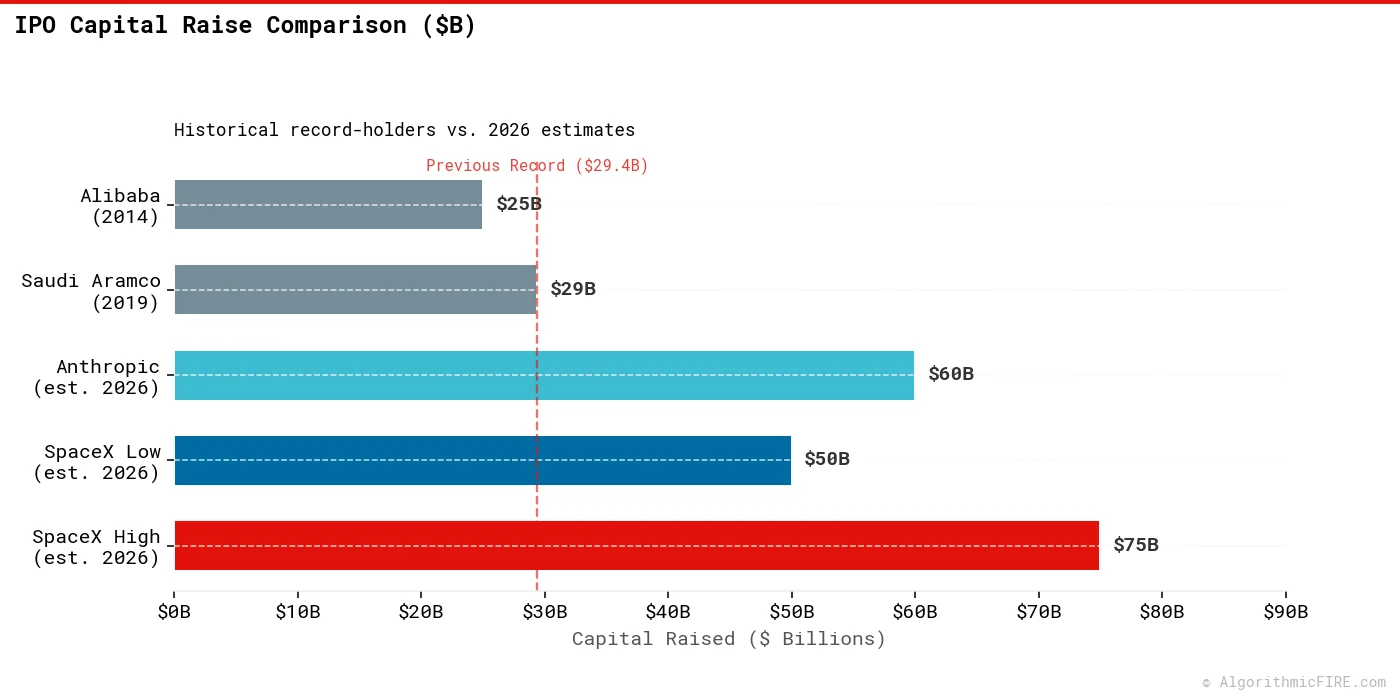
For the purposes of this analysis, we will focus on the three most imminent and largest: SpaceX, OpenAI, and Anthropic. Their combined expected valuations range from $3.0 trillion to $3.8 trillion — roughly 5–6% of the entire current S&P 500 market capitalization.
To put that in historical context: the largest IPO ever completed was Saudi Aramco's 2019 offering, which raised $29.4 billion (including the greenshoe option) at a valuation of approximately $1.7 trillion. [^11] Crucially, because Saudi Aramco is a state-owned enterprise listed on the local Saudi Tadawul exchange with strict foreign ownership limits, it was never added to major U.S. and global passive equity indices. Thus, its record IPO triggered zero forced passive rebalancing flows in common benchmark indices. In contrast, SpaceX is a U.S. company listing on a U.S. exchange, meaning it will trigger immediate and massive inclusion flows across the world's most heavily tracked passive funds. SpaceX alone is targeting a capital raise of $50–$75 billion — more than double the Aramco record.
Timing of IPOs: The Sequencing Problem
The raw valuations are striking, but the actual market impact depends on four critical variables: float size, timing, rebalancing windows, and how these flows compare to normal daily liquidity.
What Portion of Each Company's Shares Will Be Offered?
Mega-cap tech IPOs typically offer between 10% and 20% of total shares to the public. [^12] This is the "float" — the shares actually available for trading. Index weights are calculated on float-adjusted market capitalization, not total valuation. This is a crucial distinction.
| Company | Total Valuation | Est. Float Value (10–15%) | Float-Adj. Market Cap |
|---|---|---|---|
| SpaceX | $2.0T | $200B – $300B | $200B – $300B |
| OpenAI | $1.0T (target) | $100B – $150B | $100B – $150B |
| Anthropic | $950B | $95B – $143B | $95B – $143B |
| Combined | ~$3.95T | $395B – $593B | $395B – $593B |
You'll notice the float and float-adjusted market cap columns are identical. That's intentional — at IPO, the only publicly tradable shares are the float, so the two figures are the same by definition. However, this changes over time. As insider lock-up periods expire (typically 90–180 days post-IPO), additional shares enter the public market, increasing the float and therefore the float-adjusted market cap. This means the index weight — and the corresponding forced purchase by passive funds — grows in stages after the initial listing, creating multiple rounds of rebalancing pressure rather than a single event.
SpaceX's dual-class share structure (Class A: 1 vote/share for public; Class B: 10–20 votes/share for Musk/insiders) means that Musk is expected to retain approximately 79% of voting power even after the IPO. [^13] This strongly implies a relatively low float — likely closer to the 10–15% range — which constrains the initial index weight.
Will They Happen at the Same Time?
Not simultaneously, but the clustering is tight enough to matter:
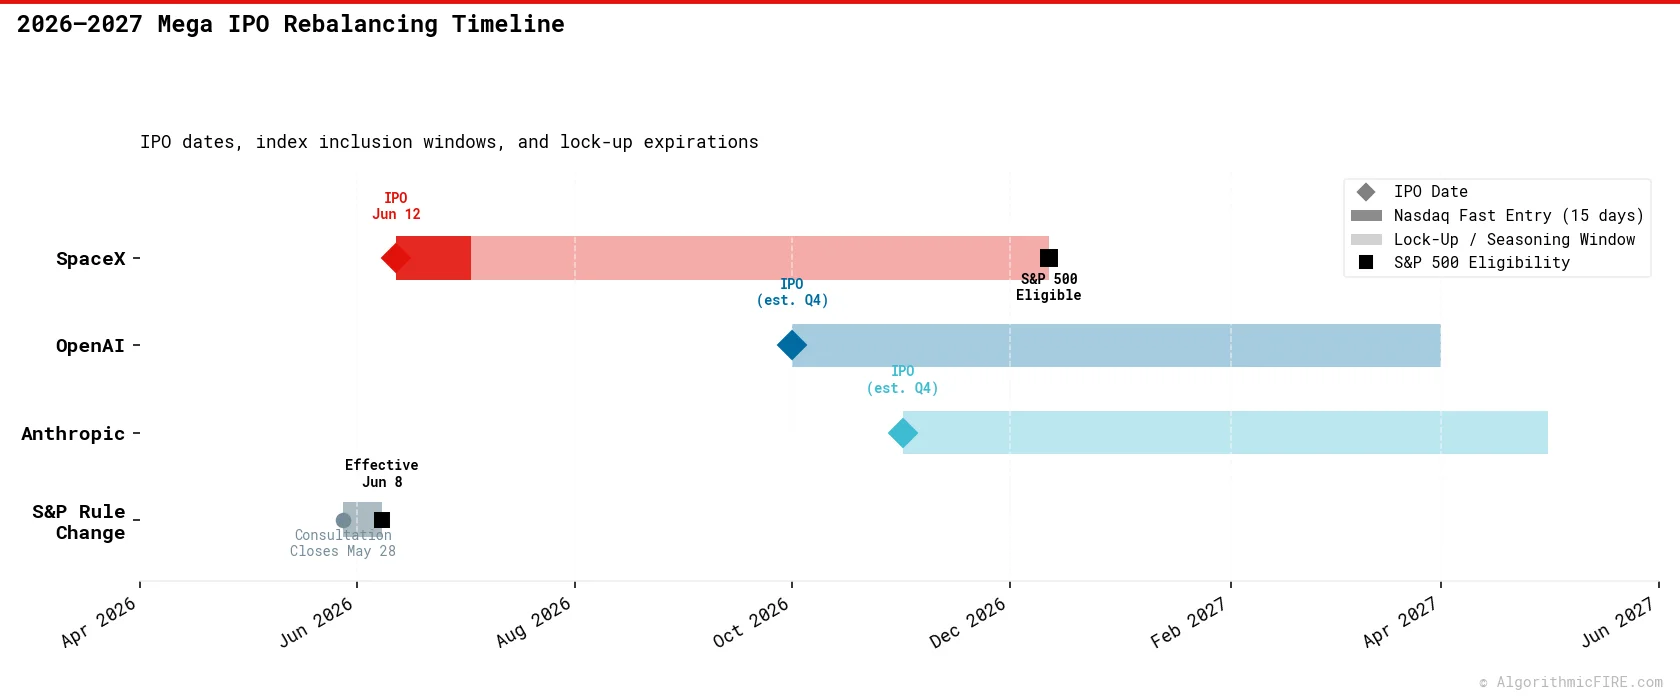
- SpaceX: Target listing June 12, 2026. This is the most concrete timeline. [^6]
- OpenAI: Speculated Q4 2026 or possibly 2027. No S-1 filed. [^7]
- Anthropic: Speculated Q4 2026. Taking "IPO readiness" steps but no formal filing. [^8]
If these IPOs are spaced 3–6 months apart, the market has time to absorb each one independently. The more compressed scenario — and the one worth modeling — is that OpenAI and Anthropic both target Q4 2026, creating a compressed window of forced rebalancing within a single quarter.
Over What Period of Time Will Funds Rebalance?
This depends on which index adds the company and how quickly:
Nasdaq-100 (Fast Entry Rule): Effective May 1, 2026, Nasdaq implemented a "Fast Entry" rule that allows mega-cap IPOs to be evaluated for inclusion on their 7th trading day and added after just 15 trading days. [^14] To qualify, the company's total market capitalization must rank within the top 40 current Nasdaq-100 constituents. SpaceX, at a $2 trillion valuation, would trivially qualify. This means QQQ and other Nasdaq-100 tracking funds could be forced to buy within three weeks of the IPO.
S&P 500 (Seasoning Period Under Review): The S&P 500 currently requires a 12-month seasoning period before a newly public company is eligible for inclusion. [^15] However, S&P Dow Jones Indices opened a public consultation (closing May 28, 2026) to potentially reduce this to 6 months and waive profitability requirements for megacap companies. If adopted, these changes could take effect as early as June 8, 2026 — just four days before SpaceX's target listing date. [^16] This methodological shift reflects structural pressure on S&P to capture the growth of trillion-dollar private giants immediately upon listing, preventing faster-moving competitors like the Nasdaq-100 (with its Fast Entry rule) from monopolizing early index inflows. If the 6-month rule is adopted, SpaceX could be eligible for S&P 500 inclusion by December 2026. OpenAI and Anthropic, if they list in Q4, could be eligible by mid-2027. Each inclusion event would trigger a fresh wave of forced selling across the existing S&P 500 to fund the purchase.
UPDATE 2026-06-05: S&P has decided to retain the 12-month seasoning period. See the official consultation results for more information. This does not materially impact the analysis in this post, only the timing of the index rebalancing.
How Does the Required Selling Compare to Daily Trading Volume?
This is the critical question. Forced selling only causes price drops if the volume of selling is large relative to normal market liquidity.
Daily Market Liquidity (Baseline):
- The U.S. equity market's average daily trading value (regular hours) reached a record $1.04 trillion in January 2026. [^17]
- The SPY ETF alone trades approximately $36 billion/day. [^18]
Estimated Forced Selling for SpaceX S&P 500 Inclusion:
If SpaceX enters the S&P 500 at a float-adjusted market cap of $250 billion, its index weight would be approximately:
Weight = $250B / ($61.1T + $250B) ≈ 0.41%
With $12 trillion tracking the S&P 500, the total forced purchase would be:
$12T × 0.41% = $49.2B
That $49.2 billion must come from selling existing holdings. And this is a conservative estimate — it only captures S&P 500-tracking vehicles. SpaceX would simultaneously be added to the Nasdaq-100 (~$300B+ in QQQ alone), total US market indexes (VTI, ITOT), and MSCI USA, each of which would trigger additional forced buying and corresponding selling. The $19 trillion total passive universe referenced earlier includes all of these vehicles, but because we cannot precisely decompose the overlap, we use the $12T S&P 500 figure as a lower bound.
If the S&P 500 rebalancing is concentrated into 1–3 trading days (as was the case with Tesla), this forced selling of existing holdings ($49.2 billion) represents 1.6–4.7% of the entire market's average daily trading value. This is a massive, one-directional sell order dumped across the remaining constituents in a compressed window.
Now extrapolate to a scenario where SpaceX, OpenAI, and Anthropic are all added within a 12-month window:
| Company | Est. Float-Adj. Cap | S&P Weight | Forced Purchase ($12T base) |
|---|---|---|---|
| SpaceX | $250B | 0.41% | ~$49B |
| OpenAI | $125B | 0.20% | ~$24B |
| Anthropic | $120B | 0.20% | ~$24B |
| Total | $495B | 0.81% | ~$97B |
That is $97 billion in forced selling of existing S&P 500 holdings to fund the purchases. Because these additions are highly likely to occur in phases—both at each company's initial IPO listing and when insider lock-ups expire 90–180 days later—this passive flow will be spread across 3–6 discrete rebalancing events over a 12-month window (or even more trading sessions if funds spread the execution of these massive flows over 1–2 days to minimize market impact). Each individual event is manageable relative to daily volume ($1T/day), but the cumulative effect — especially if front-running behavior amplifies the selling — could create a persistent headwind for the market's existing constituents.
(Note: this calculation covers only S&P 500-tracking vehicles. Nasdaq-100, total-market, and international index funds would add to this figure — a point we return to in the liquidity section below.)
The Amplification Factor: Inelastic Markets
The analysis above treats every dollar of forced selling as exactly one dollar of market impact. But there is a well-established body of academic research — largely absent from the current IPO coverage — suggesting the actual impact is significantly larger.
The Inelastic Markets Hypothesis, developed by Xavier Gabaix (Harvard) and Ralph Koijen (Chicago Booth) and published in 2021, argues that modern equity markets are far less elastic than traditional finance models assume. [^19] Their central finding: an exogenous flow of $1 into the stock market increases aggregate market capitalization by approximately $5. This is the "multiplier effect."
The mechanism is straightforward. In a fully elastic market, when index funds sell $49 billion of existing holdings, active managers and hedge funds would step in to buy those shares at a small discount, absorbing the flow with minimal price impact. But Gabaix and Koijen show that most capital in the market is not price-sensitive — it is locked in retirement accounts, pension mandates, and other passive vehicles with rigid allocation rules. There simply are not enough active, contrarian buyers to absorb the flow without meaningful price concessions. [^19] [^20]
Mike Green, a portfolio manager who has popularized this framework, extends the logic to its inverse: if passive inflows amplify prices on the way up, passive outflows amplify them on the way down. [^20] When index funds sell existing holdings to buy a newly added stock, they are creating a concentrated, non-discretionary sell flow in hundreds of companies simultaneously. The remaining active participants — who represent a shrinking share of total market capital — must absorb all of that selling. If they lack the capacity or willingness to do so, prices overshoot to the downside until a new buyer appears.
What Does This Mean for the IPO Rebalancing?
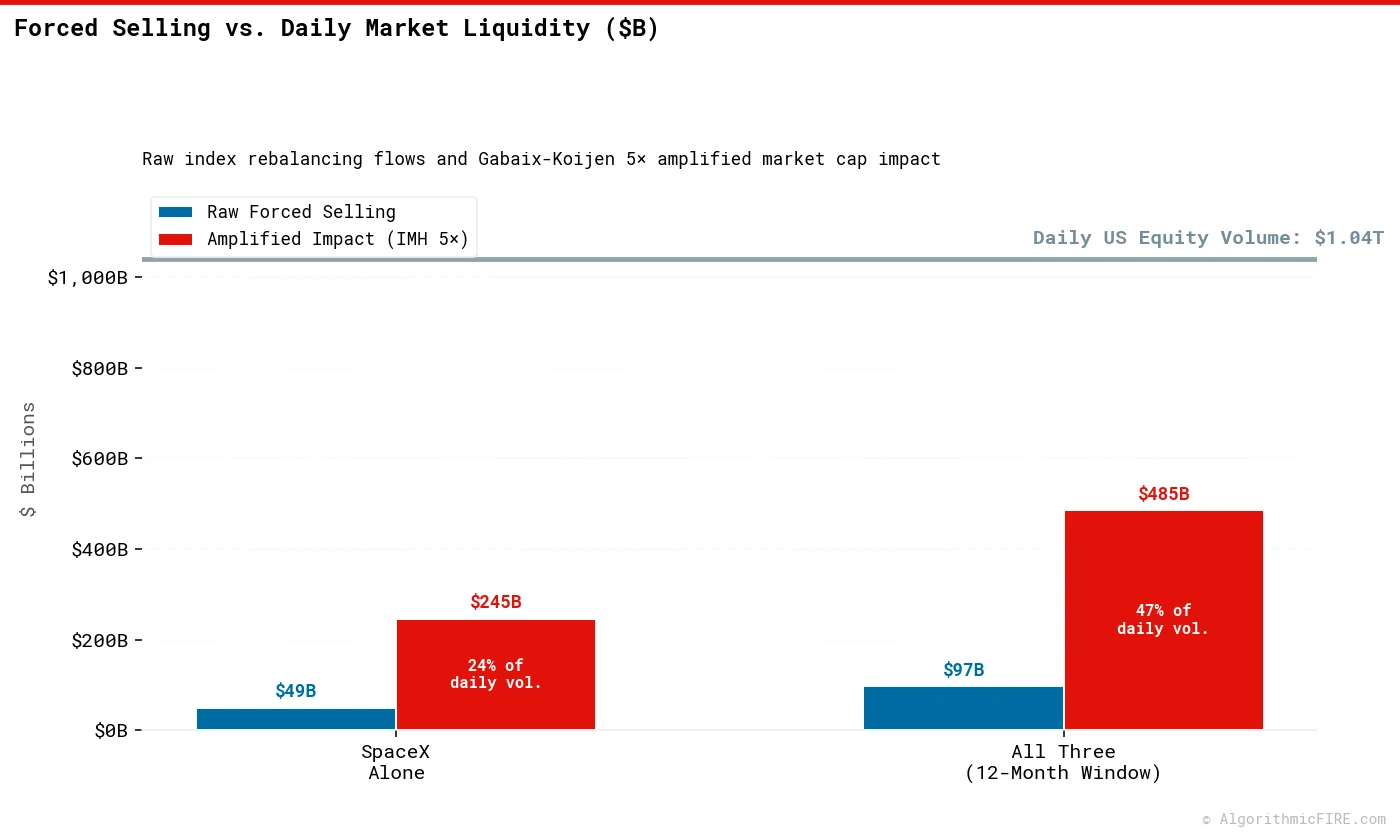
If the Gabaix-Koijen multiplier of ~5x holds, the ~$97 billion in cumulative forced selling across three mega-IPO inclusions would not reduce aggregate market capitalization by $97 billion. The implied impact would be closer to $300–$500 billion — spread across the existing S&P 500 constituents as a broad, diffuse headwind.
To be clear: this is a theoretical upper bound, not a prediction. The multiplier is an aggregate estimate derived from historical flow data, and real-world outcomes depend heavily on market conditions, liquidity, and whether active managers choose to lean into or away from the selling. But the framework provides a useful lens: the raw dollar figures in the rebalancing tables above may understate the actual price impact by a factor of 3–5x.
| Scenario | Forced Selling | Implied Market Cap Impact (5x) |
|---|---|---|
| SpaceX alone | ~$49B | ~$245B |
| All three (12-month window) | ~$97B | ~$485B |
It is worth examining that impact through two distinct lenses:
Lens 1 — The Stock Perspective (Market Cap Drag): On the day of the SpaceX rebalance, the $245 billion in implied market capitalization displacement (5× multiplier on the $49B SpaceX-only S&P flow) represents a 0.40% aggregate drag across the $61.1 trillion index. Cumulatively over the 12-month window, the total $485 billion displacement across all three listings represents a 0.80% aggregate drag. In isolation, these single-day and cumulative figures sound modest — roughly equivalent to a single below-average trading day.
Lens 2 — The Flow Perspective (Liquidity Absorption): The U.S. equity market processes roughly $1 trillion per day in total trading value. The cumulative forced selling of ~$97B across all three listings represents roughly ~10% of a single day's market volume if compressed into one session. However, because these events are spread over a 12-month window, any single rebalancing session is much smaller. For example, the SpaceX rebalance represents ~$49B of forced selling, or ~4.9% of a single day's market volume. In isolation, those raw flow figures sound manageable.
But the raw flow is not the right measure of impact. Applying the Gabaix-Koijen 5× multiplier, the implied market cap displacement from the SpaceX-only selling is ~$245B — the same figure established in Lens 1. This translates to ~$245B of market cap pressure in that single rebalance session, or ~24% of a full day's total market volume — all of it non-discretionary, one-directional, and price-insensitive.
But that aggregate comparison understates the stress, because it uses the wrong denominator. To analyze this correctly, we must separate the actual dollar flows from the resulting price drop:
- Estimated Price Impact (The Multiplier): Applying the Gabaix-Koijen 5× multiplier to the $49.2B of forced S&P 500 selling implies a final market capitalization drag of ~$246B (as detailed in Lens 1).
- Actual Transaction Flows (The Trading Volume): But before that price adjustment settles, the actual shares must be sold in the market. This is the raw dollar amount of transactions ($49.2B from S&P 500 rebalancing alone) that must physically change hands in the order books.
The relevant question for immediate liquidity stress is not what fraction of total market cap is displaced, but what fraction of each individual stock's daily trading volume is being hit with forced, one-sided selling in that single rebalancing session.
(Note: While SpaceX would also be added to the Nasdaq-100, MSCI USA, and total-market funds, index providers operate on completely different rebalancing schedules, meaning these inclusions will occur as discrete events on separate days. Furthermore, the S&P 500's ~$12 Trillion in passive AUM completely dwarfs the Nasdaq-100's passive base. For clarity, we focus our peak stress analysis solely on the massive S&P 500 rebalance day, recognizing that other indices will add smaller, independent waves of pressure.)
Using verified index weights (May 2026), we can calculate the forced selling of existing constituents on the S&P 500 Rebalance Day ($49.2B total flow), and see how the 5× multiplier amplifies this pressure relative to daily trading volume:
| Company | S&P 500 Weight | S&P 500 Sell Flow | Daily Volume | S&P Raw % of ADV | S&P 5× Amplified |
|---|---|---|---|---|---|
| Nvidia (NVDA) | 7.5% | $3.7B | ~$34.0B | ~11% | ~55% |
| Apple (AAPL) | 6.0% | $3.0B | ~$14.4B | ~21% | ~105% |
| Alphabet (GOOGL) | 4.0% | $2.0B | ~$10.0B | ~20% | ~100% |
| Microsoft (MSFT) | 4.5% | $2.2B | ~$14.1B | ~16% | ~80% |
| Amazon (AMZN) | 3.5% | $1.7B | ~$12.1B | ~14% | ~70% |
Sources: S&P 500 weights from S&P Dow Jones Indices (May 2026); daily volumes from Robinhood/YCharts (May 2026).
Every one of these stocks faces 11–21% of its entire average daily trading volume (ADV) in non-discretionary, one-directional selling on the S&P 500 rebalance day. When we apply the Gabaix-Koijen 5× multiplier to reflect market inelasticity, this forced selling behaves like a one-sided imbalance equal to 55% to 105% of their entire daily trading volume.
For example, on the S&P 500 rebalance day, Apple (AAPL) faces an S&P-only flow equal to 21% of its volume, translating into a 105% amplified imbalance under inelastic market conditions. On that same day, the mechanical flow out of Alphabet (GOOGL) represents 20% of its daily volume—which behaves like a massive 100% imbalance. And this happens simultaneously across all five highly-capitalized names. And this will happen to a lesser extent with the OpenAI and Anthropic IPOs as well.
The primary unknown is what will happen to stock prices, with large sales, in a market where much of the capital is passively managed. How can there be a bid when there is no buyer?
Why These Estimates Are Conservative
It is critical to note that the $97 billion in forced selling modeled in this analysis represents a conservative baseline lower bound, not a worst-case scenario:
- S&P 500-Centric Underestimation: Our figures are built almost entirely on the $12 trillion benchmarking the S&P 500. They ignore the remainder of the $19.1 trillion total passive equity universe, including the Nasdaq-100 (QQQ), total U.S. market indexes (VTI, ITOT), MSCI USA, and global benchmarks. When these funds rebalance on their respective schedules, the actual forced selling of existing constituents will be significantly larger.
- Active Benchmarked Hugging: Many "active" mutual funds and institutional managers are measured directly against the S&P 500 or Nasdaq-100. To avoid severe tracking error against these indices, these active managers are structurally pressured to replicate the index changes, forcing them to sell existing holdings to buy the IPOs.
- Minimum Initial Float (10–15%): We modeled the absolute minimum initial public float. As insider lock-up periods expire (90–180 days post-IPO), subsequent share registrations and insider sales will expand the float-adjusted market capitalization, forcing passive funds to execute subsequent waves of buying (and additional selling of existing holdings).
- Exclusion of Other Trillion-Dollar Pipelines: This model only covers SpaceX, OpenAI, and Anthropic. If other massive private giants waiting in the wings—such as Stripe ($159B) or Databricks ($134B)—listing in the same 12-month window are included, the mechanical selling pressure multiplies.
The Bottom Line
The upcoming mega-IPO cycle has no direct historical precedent in combined scale and velocity. The numbers suggest that while no single IPO is likely to cause a broad market decline, the cumulative effect of three or more trillion-dollar listings within a compressed timeframe creates a structural liquidity drain that passive investors should be aware of.
Key takeaways:
- The mechanics are real. Index funds must sell existing holdings to buy new additions. This is not speculation — it is structural plumbing.
- The scale exceeds all precedent. The combined capital raise from SpaceX alone ($50–$75B) would more than double the current all-time IPO record (Saudi Aramco, $29.4B). Crucially, while Aramco was listed on a local foreign exchange and excluded from major passive benchmarks, SpaceX will list on a U.S. exchange and immediately enter major U.S. and global indices, triggering unprecedented passive rebalancing pressure. The combined forced rebalancing across all three companies could approach $100 billion.
- The timeline is compressed. Rule changes at both Nasdaq (Fast Entry) and S&P (6-month seasoning consultation) are designed to accelerate inclusion. This concentrates the selling pressure into shorter windows.
- But the market is deep. U.S. equity markets trade over $1 trillion per day. While concentrated rebalancing events will create short-term volatility — as they did with Tesla — the market has historically absorbed these shocks within days to weeks.
- The real risk is the second-order effect. If large active managers — not just passive funds — simultaneously sell existing holdings to participate in these "must-own" IPOs, the selling pressure could be amplified beyond what the index mechanics alone would dictate.
- The "Index Drag" on passive holders. While individual stock holders face concentrated downward pressure on their specific mega-cap holdings, index holders do not escape unscathed. Because passive funds are forced to buy the new megacap (SpaceX) at the exact moment of inclusion—typically when its share price is temporarily inflated by front-running active traders—while simultaneously selling their existing assets at a forced discount to fund the buy, index holders suffer from "index inclusion drag" (effectively selling low and buying high).
For long-term investors, this is not a reason to change strategy. But it is a reason to understand the plumbing. The passive investing revolution has created a system where the addition of a single company to an index can force the mechanical sale of hundreds of others. When three of the most highly valued private companies ever enter that system within 12 months of each other, the pipes will be tested.
References
[^1]: S&P Dow Jones Indices, "S&P U.S. Indices Methodology," spglobal.com. Describes index rebalancing mechanics, announcement windows, and tracking error obligations.
[^2]: Research Affiliates, "Tesla's S&P 500 Inclusion: A Case Study in Index Effects," researchaffiliates.com (2021). Documents the $78–$94B estimated forced purchase and 57% price run-up.
[^3]: Los Angeles Times, "Tesla joins the S&P 500 in one of the biggest index reshuffles ever," latimes.com (Dec 2020). Reports 222 million shares traded and $148B in dollar volume.
[^4]: Investment Company Institute (ICI), "2026 Investment Company Fact Book," ici.org; Vanguard, iShares, State Street, Fidelity fund pages (May 2026). Fund AUM figures and total S&P 500-benchmarked assets exceeding $12T.
[^5]: Investment Company Institute, "Trends in Mutual Fund Investing, March 2026." Reports $19.09T in total U.S. indexed fund/ETF assets, surpassing $16T in active funds.
[^6]: Multiple sources including Kiplinger, TradingKey, and Mashable (May 2026). SpaceX S-1 confidential filing (April 2026), target Nasdaq listing June 12, 2026, ticker SPCX, valuation $1.75T–$2T, capital raise $50B–$75B.
[^7]: OpenAI corporate disclosures and financial reporting (March 2026). Post-money valuation of $852B. Restructured to Public Benefit Corporation October 2025. IPO speculated Q4 2026 or 2027.
[^8]: Anthropic funding disclosures; Investing.com, Business Insider, PYMNTS (Feb–May 2026). Series G at $380B (Feb 2026). Secondary market activity at $900B–$950B. Estimated IPO raise of ~$60B.
[^9]: Stripe tender offer (Feb 2026) at $159B valuation. Payments Dive, Motley Fool (2026). Leadership has stated they are "in no rush" to IPO.
[^10]: Databricks $5B funding round (Feb 2026) at $134B valuation. Stock Analysis, CoinCodex (2026).
[^11]: CBS News, Business Insider, G2.com. Saudi Aramco IPO (Dec 2019): $25.6B initial raise, $29.4B with greenshoe. Valuation ~$1.7T.
[^12]: Nasdaq.com, Renaissance Capital. Historical analysis of mega-cap tech IPO float percentages, typically 10–20% of total equity.
[^13]: SpaceXStock.com, KeepTrack.space, Responsible Investor (May 2026). Dual-class structure: Class A (1 vote), Class B (10–20 votes). Musk expected to retain ~79% voting power.
[^14]: Nasdaq OMX Methodology Updates (effective May 1, 2026). "Fast Entry" rule: evaluation on 7th trading day, inclusion after 15 trading days for companies ranking in top 40 by total market cap. Ashurst, Kiplinger, Medium (2026).
[^15]: S&P Global, "S&P U.S. Indices Methodology." Current 12-month seasoning requirement for S&P 500 eligibility.
[^16]: Seeking Alpha, Substack, Reddit (May 2026). S&P consultation to reduce seasoning to 6 months, open until May 28, 2026, potential effective date June 8, 2026.
[^17]: RBLT.com, citing consolidated U.S. equity market data. Average daily trading value (regular hours) reached record $1.04T in January 2026.
[^18]: Robinhood, citing SPY average daily volume of ~48.93M shares at ~$734–$741/share = ~$36B/day (May 2026).
[^19]: Xavier Gabaix and Ralph S.J. Koijen, "In Search of the Origins of Financial Fluctuations: The Inelastic Markets Hypothesis," NBER Working Paper 28967 (2021); published in the Journal of Finance. Estimates a price multiplier of ~5x for aggregate equity market flows. Available at nber.org. Also discussed in T. Rowe Price, "The Inelastic Markets Hypothesis," and AQR, "Gabaix and Koijen on Inelastic Markets."
[^20]: Mike Green, portfolio manager and researcher. Extended the Gabaix-Koijen framework to argue that the growth of passive indexing has structurally reduced market elasticity, amplifying both inflows and outflows. Discussed in interviews on the Excess Returns Podcast, ETF Stream, and Invest Resolve.