The Rise Above: Visualizing the Efficiency of Trend-Following

Is your portfolio achieving genuine alpha, or simply increasing volatility for marginal returns? We analyze the Selection Matrix and why vertical scaling (Efficiency) carries more weight than linear growth (CAGR).

In our cornerstone post, “Defending Your Savings Against Significant Downturns,” we established a sobering truth: even in modern markets, it is possible to lose close to 50% of your portfolio in a very short period of time and not have it recover in your retirement timeframe. Drawdowns in the range of 20-30% are certainly possible. These levels of volatility are difficult to stomach at any age but are particularly devastating for those in or near retirement. The key to a successful retirement is to ensure that your portfolio is resilient enough to withstand these shocks.

As we detailed in our analysis of Sequence of Returns Risk, early losses combined with withdrawals "lock in" the damage, potentially depleting a portfolio before the market has a chance to recover. To navigate this, we need more than just a list of returns—we need a map of efficiency.


Introducing the "Rise Above" Matrix

The AlgorithmicFIRE Model Portfolio Hub features a powerful interactive tool: the Selection Matrix. This chart is designed to tell a three-dimensional story of how your money is actually working:

  • X-Axis: Annual Return (CAGR %) – This represents your "linear growth rate." It measures the raw compounded growth of your investment. As we noted in "Average Return - It’s Not What You Think," CAGR is the only mathematically sound way to measure this growth.
  • Y-Axis: Sharpe Ratio (Risk-Adjusted Efficiency) – This is your "Statistical Efficiency." A higher Sharpe ratio indicates you are capturing more return per unit of volatility.
  • Bubble Size: Max Drawdown (The "Pain") – The size of the bubble represents the largest historical drop during the period modeled (5 years in this example). In a research-grade portfolio, we want this metric to be as low as possible.

The Visual Metaphor: The Ascent

The Selection Matrix showing the "Rise Above" effect

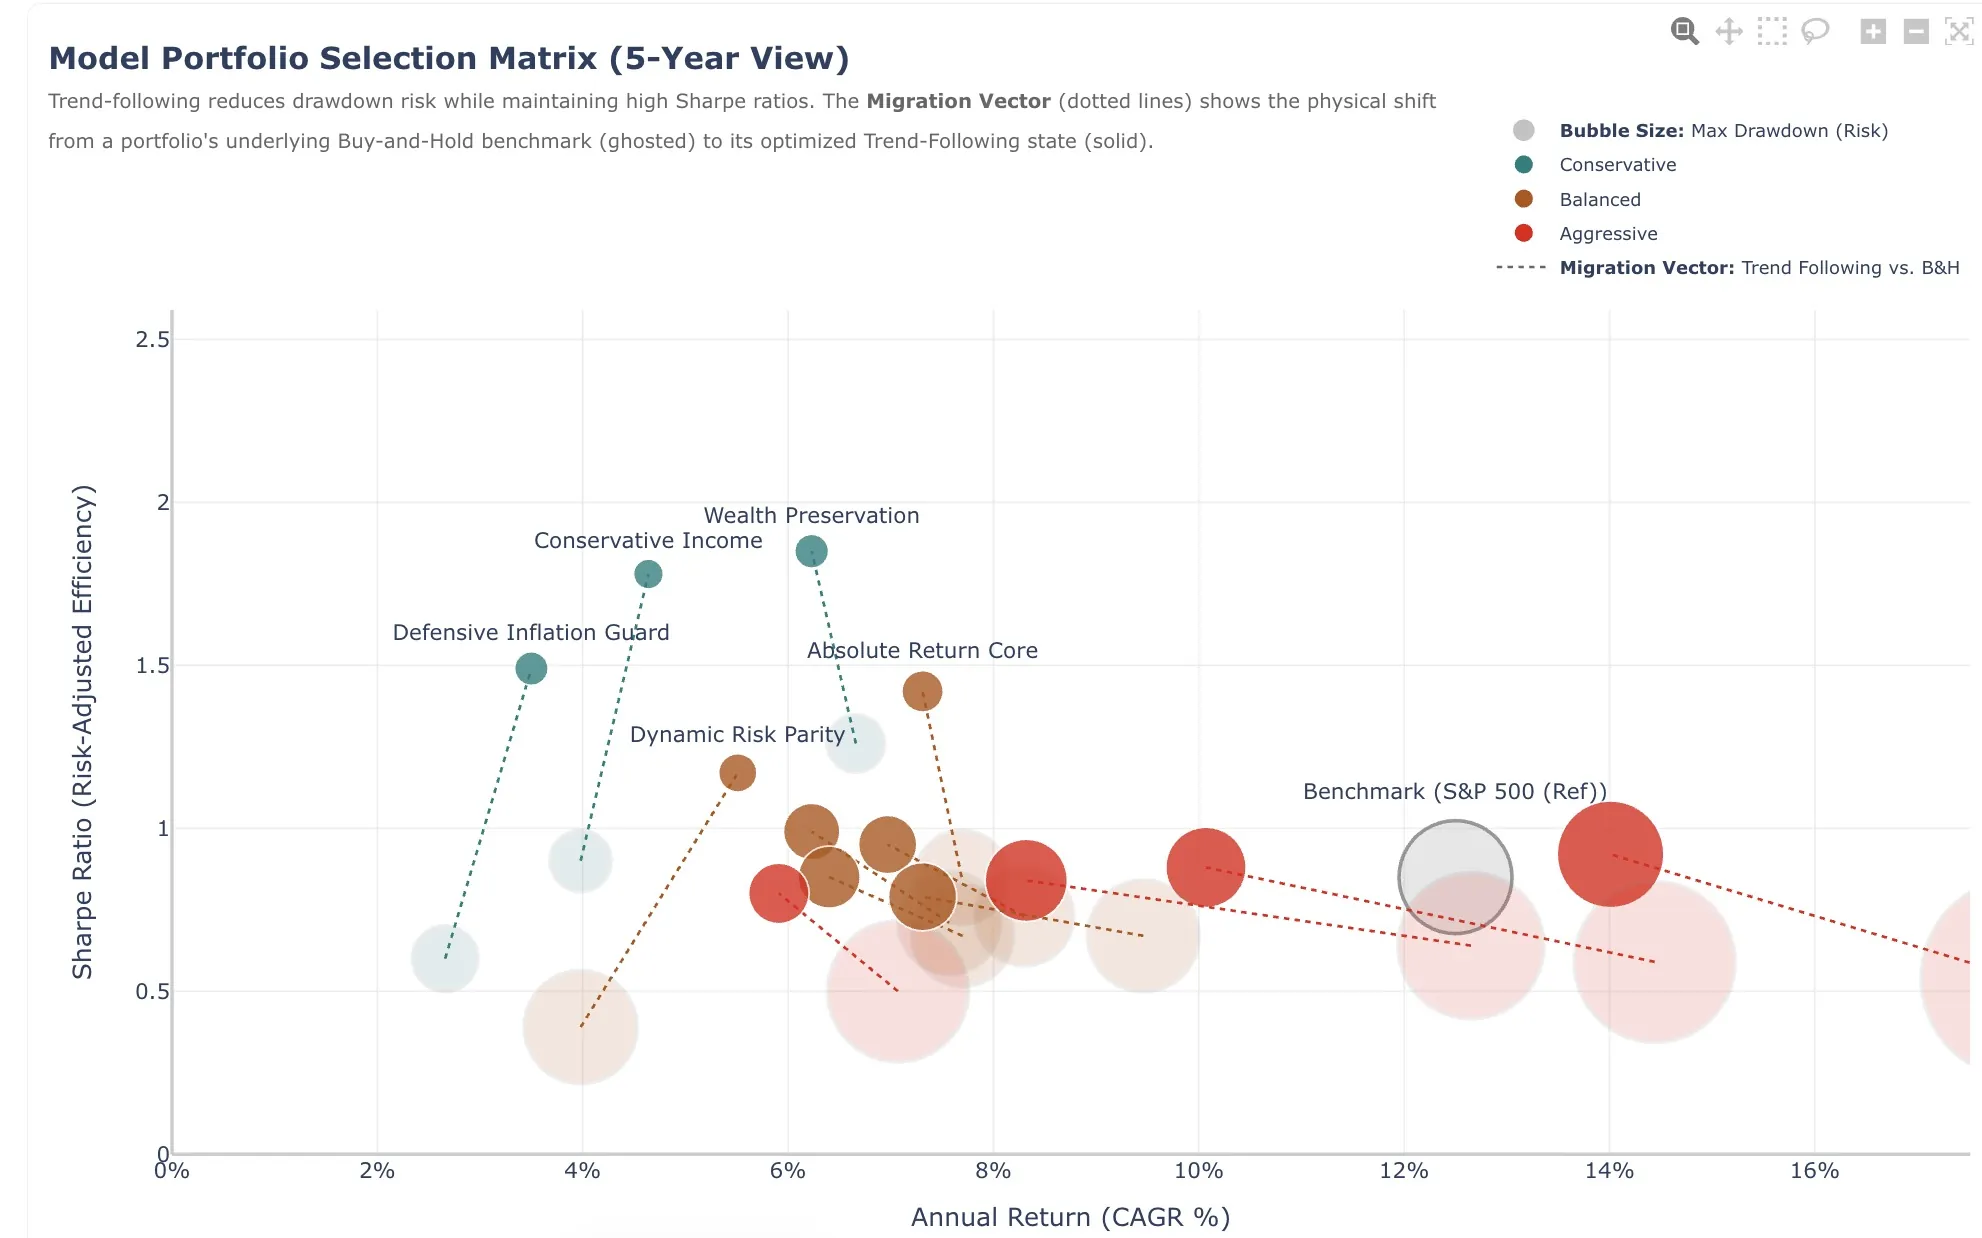
When you look at the matrix, the statistical impact of trend-following is illustrated by the Trajectory Vector (the dotted lines). Every model portfolio starts its journey at a "Baseline Point"—its underlying Buy-and-Hold benchmark.

As you follow the dotted line to the solid "Strategy Point," you are witnessing a Migration toward Efficiency. You will notice two things happen simultaneously:

  1. Efficiency Gain: The portfolio scales vertically, moving to a higher Sharpe ratio (improving return per unit of risk).
  2. Volatility Reduction: The significant drawdown bubble of the benchmark physically contracts into a much smaller, tighter strategy bubble.

This visual migration demonstrates the core thesis: you aren't just observing a static return—you are observing the active mitigation of risk in real-time. Even if a portfolio moves slightly to the left in terms of raw CAGR, the vertical gain in efficiency is what enables long-term survival.


Up, Right, and the Lifecycle Shift

Understanding how to move on this map is the key to a successful long-term strategy:

  1. Moving Right (Accumulation): When you are in the accumulation phase, maximizing CAGR is the priority. As long as your Sharpe ratio (Efficiency) remains research-grade, you are essentially "purchasing" growth at a fair risk price.
  2. Moving UP (The Optimization Frontier): Moving vertically indicates you are achieving a higher Sharpe ratio. You are capturing more return per unit of risk. This is the quantitative advantage of the AlgorithmicFIRE models.
  3. The Retirement Pivot (Up and Left): As you transition from accumulation to depletion (retirement), your goal should progressively shift Up and to the Left. You want to maximize efficiency and capital preservation. You are intentionally trading the "noise" of high CAGR for the stability of a high Sharpe ratio and a minimal drawdown.

The Heroes vs. The Warnings

Not all bubbles on the matrix are created equal. In fact, some are there to serve as a cautionary tale.

The Heroes: Absolute Return & Wealth Preservation

The standout performers on our chart are models like Absolute Return Core. These sit in the "Up and Left" quadrant relative to the aggressive models. They demonstrate the efficiency migration: slashing historical drawdowns by a significant margin while only sacrificing a minor amount of CAGR. For a retiree, the vertical gain in efficiency is far more valuable than the horizontal distance they lose in returns.

The Warning Zone: The Diminishing Returns of Leverage

You will notice our most aggressive models (like Aggressive Alpha Momentum) sit further to the right, but their "altitude" (Sharpe ratio) is often no better than the S&P 500 benchmark.

These models utilize leveraged ETFs like TQQQ (3x Nasdaq-100) and QLD (2x Nasdaq-100). We include them not as recommendations, but as warnings. They illustrate a critical concept: Volatility Decay.

A 3x leveraged fund does not provide 3x the CAGR over the long term. Instead, the "choppiness" of the market eats away at the returns. In these aggressive models, you are taking on massive complexity and visceral risk for only marginal CAGR gains.

Crucially, CAGR alone does not guarantee success when withdrawals are being made. As we demonstrate in our Safe Withdrawal Rate analysis, high-volatility assets like 100% stocks (and by extension, leveraged stocks) often fail in retirement scenarios despite their high returns, because the "Sequence of Returns" risk overwhelms the growth.

Entry into these strategies should never be taken lightly; for most investors, the quantitative advantage is found in the efficiency of the diversified models, not the raw power of the leveraged ones.


Risk/Return Realities: The Vertical Drop in Pain

If the Selection Matrix is the "Research View," our second analysis—CAGR vs. Max Drawdown—is the "Risk-Adjusted Reality" view.

When you plot CAGR on the X-axis and Drawdown on the Y-axis, the trend-following advantage becomes undeniable. You see a clear vertical scaling toward safety. While the S&P 500 sits deep in the "Risk Zone" at -24% drawdown, our conservative models remain above the volatility, sitting at the top of the chart with drawdowns as low as -3% to -5%.

This is why we have updated our interactive matrix to include the Efficiency Migration paths. We don't just want to show you where we are now; we want to show you the distance we've traveled away from the volatility of traditional buy-and-hold benchmarks.

CAGR vs Max Drawdown showing the Vertical Ascent to Safety

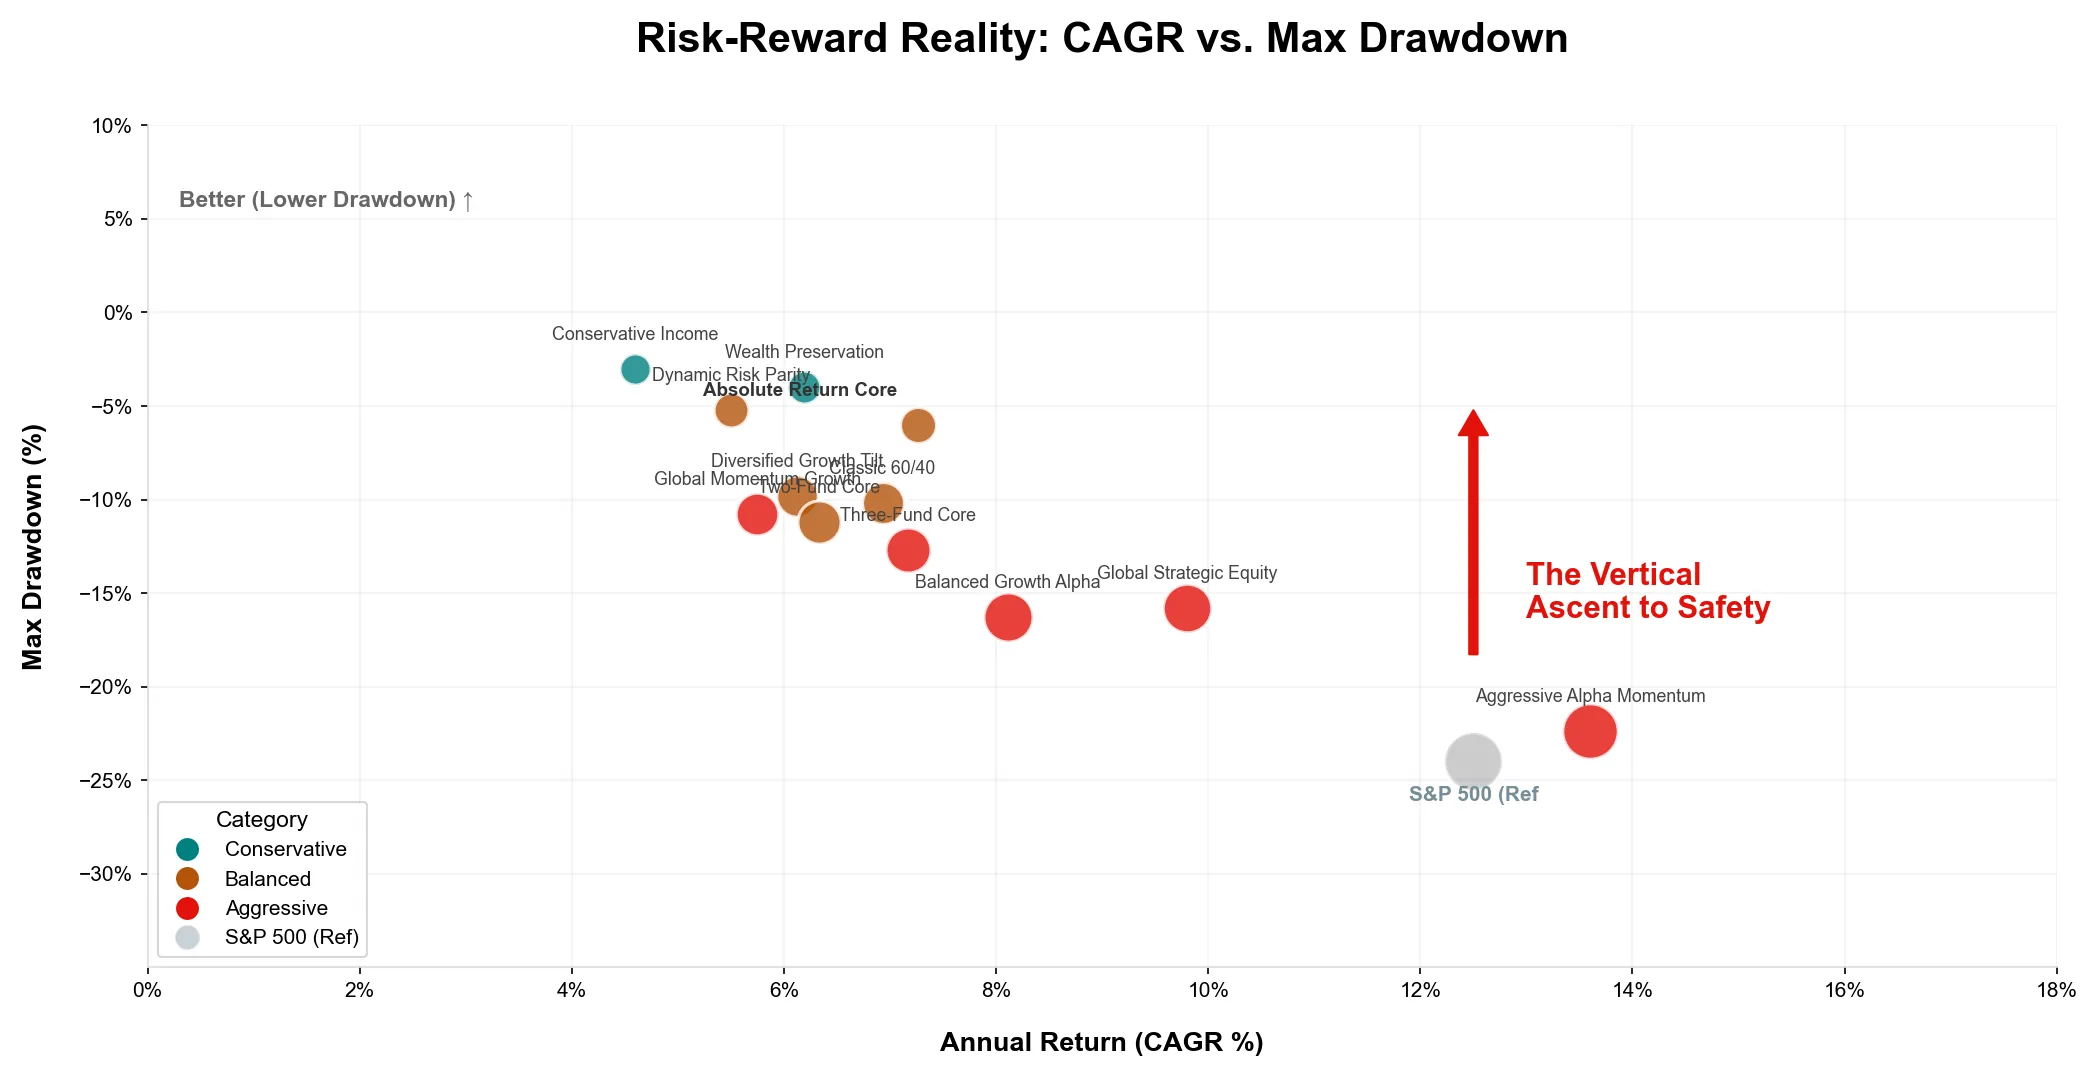
Visualizing that vertical distance is the key analytical takeaway for most investors. It proves that you don't have to stay in the line of fire to remain active in the market.


Conclusion: Choosing Your Optimal Altitude

FIRE investing isn't about finding the fastest car; it's about building the one with the most robust failure modes. The Selection Matrix is your GPS.

Whether you are seeking the "Efficiency Hero" of Absolute Return Core or the "Defensive Anchor" of Wealth Preservation, the goal is to find the optimal altitude for your current stage of life.

Ready to find your position on the frontier?

Explore the interactive Model Portfolio Hub today and see how our strategies rise above the market's inefficiency.

Free Download: The AlgorithmicFIRE Curriculum Book

Download our complete 200+ page guide on Safe Withdrawal Rates, sequence of returns risk, tax optimization, and asset allocation to read offline on any device.

Get Free PDF (200+ Pages) →

Frequently Asked Questions

Portfolio efficiency refers to maximizing returns for a given level of risk. This is often visualized using the Efficient Frontier, a concept from Modern Portfolio Theory that plots the optimal asset allocations that offer the highest expected return for a defined level of volatility.

The Efficient Frontier is a curve on a graph representing a set of portfolios that maximize expected return for a given level of risk. Any portfolio sitting below the curve is considered 'inefficient' because you could achieve a higher return for the same exact amount of risk.

By combining assets that are not perfectly correlated (like stocks and bonds), you can actually reduce the overall volatility of the portfolio without sacrificing proportional returns. This is often called the only 'free lunch' in investing.

Continue Your Research


Thanks for reading! Feel free to share this post, and follow us on social media:

X Yahoo Finance Share
Paul Dunn Profile
Written by Paul Dunn

Founder & Lead Engineer at AlgorithmicFIRE

Paul Dunn applies software engineering and data analysis principles to retirement planning. As a data engineer, he designs quantitative simulators (Monte Carlo, SWR sweep, tax optimizers) to verify portfolio longevity against historical and statistical cycles.


View Video Transcript

Imagine this. You've been working your entire life, saving diligently year after year, and then boom, you watch half of your nest egg completely vanish just as you're finally getting ready to retire. It's a total nightmare scenario, right? But here's the thing, it's actually highly avoidable. Welcome to the explainer. Today, we're unpacking the algorithmic fire framework to show you exactly how to navigate wild market volatility without crashing your retirement. So, if you're serious about long-term capital preservation, you are absolutely in the right place. Let's get into it. Right out of the gate, we need to ask a crucial question. Is your investment engine actually efficient? Or are you kind of just flooring the gas pedal on risk, crossing your fingers for a return that might only barely beat the baseline? The truth is, way too many investors take on massive hidden structural risks without even realizing it. And that's mostly because they're solely focused on one single metric, average annual returns. But, you know, we really need to look a lot deeper than that because we have to ground ourselves in the terrifying reality of modern markets. Look, even today with all of our advanced tools, it is entirely possible to lose 20, 30, or in really severe cases, almost 50% of your portfolio in just a matter of months. And for those of us nearing the finish line, that's not just a bad quarter. That is a catastrophic financial event. Literally something that can permanently alter your quality of life and push your retirement back by decades. No way we want that. Which brings us to the absolute silent killer of retirements, sequence of returns risk. Here's how it works. If you experience severe market losses exactly when you start taking withdrawals, you're forced to sell your shares at a massive discount just to pay your everyday bills. You're effectively locking in irreversible damage. Why? Because when the market finally recovers a few years down the line, you have far fewer shares left to actually ride that wave back up. The math just completely turns against you. Okay, moving to section one, mapping true portfolio efficiency. To solve this terrifying problem, just staring at a basic list of average returns isn't going to cut it. We need a totally new GPS for your investments. A way to move way beyond just raw returns and chart exactly how hard your money is actually working for you behind the scenes. But before we open up this map, we've got to define our coordinates, right? First up is CAGR, your compound annual growth rate. Think of this as your raw horizontal speed. Then we have the sharp ratio. Think of this one as your vertical altitude. This is your risk adjusted efficiency. It measures exactly how much actual reward you're getting for every single unit of stress and risk you take on. Look, high speed is great, but high altitude, that's what actually keeps you out of the turbulence. And when you put that speed and altitude together, you get this really brilliant solution, the algorithmic fire selection matrix. What we're looking at here plots exactly how different model portfolios perform over a standard 5-year view. Take a second to notice how wildly these portfolios spread out across the board. Some of them are incredibly fast, but they're flying dangerously low to the ground, while others soar way up high, achieving just incredible efficiency. Now, what makes this view so revealing is the three-dimensional story it's telling us. Down on the x-axis, we're tracking that horizontal speed. Over on the y-axis, your vertical altitude. But the real kicker here, it's the size of the bubbles. That volume visually represents your maximum historical draw down. In other words, it's the visceral stomachdropping pain of the largest drop during that period. A tiny bubble sitting high up. Yeah, that's your safe haven. Let's move into section two. Navigating the map and the life cycle pivot. Because you know, your optimal position on this matrix isn't static. It doesn't just sit in one spot forever. It physically shifts as your life changes, as your goals evolve, and crucially, as you transition from building your wealth to actually living off of it. So, your investment journey basically follows three distinct steps. First, during your accumulation phase, you want to move far to the right to capture all that raw CAGR growth. Second, you want to move vertically. This is the holy grail of investing, getting way more return for less risk. And finally, as you start depleting your wealth, you've got to execute the critical retirement pivot, moving up and to the left. Honestly, this is often the hardest step psychologically, especially if you spent decades totally conditioned to just chase speed. But in retirement, the rules of the game completely flip. You absolutely must intentionally trade the choppy noise and thrill of high returns for extreme ironclad capital preservation. The ultimate goal here is to lock in a high sharp ratio and shrink that draw down bubble so it's as physically small as possible. In this phase, vertical efficiency is vastly more valuable than horizontal speed. Why? Because minimizing losses is what actually guarantees your financial survival. All right, section three, heroes and warning zones. As we study this map a bit closer and look at the actual portfolios, it becomes perfectly clear that not all bubbles are created equal. You really need to know which ones to aim for and which ones to avoid like the plague. Some of these portfolios are total heroes while others are stark warnings. Let's look at the absolute return core model. An absolute efficiency hero. It sits way high up into the left drastically slashing your draw downs while sacrificing only a really minor fraction of speed. Contrast that with our cautionary tales. Those highly aggressive models marooned way out on the right. They're taking on terrifying levels of risk for well almost no additional reward. And those aggressive models, they sit deep in the warning zone. They utilize leveraged ETFs like the three times leverage TQQQ. Actually, the source material includes these strictly as a flashing red warning. Definitely not a recommendation because they introduce massive complexity and immense visceral risk for what honestly amounts to just marginal gains over the baseline. I mean, you're basically taking on triple the stress for just a fraction of extra speed. Make it make sense, right? Plus, these aggressive models perfectly expose a hidden danger of volatility decay. A three times leverage fund doesn't just magically triple your wealth. The daily mathematical choppiness of the market actually eats away at your capital over time, compounding directly against you. It just proves that raw speed alone won't save you when you're actively taking withdrawals because those highly volatile assets fundamentally break down mathematically in a retirement scenario. Moving to section four, the vertical ascent to safety. Now, let's transition from the theoretical research of the matrix over to the stark tangible reality for everyday investors. We really need to see the true real world impact of prioritizing this efficiency. When you plot annual return directly against maximum draw down, the advantage of prioritizing efficiency becomes completely undeniable. Look closely at that powerful red arrow pointing straight up. It highlights a stunning vertical ascent to safety for the conservative models. When compared to the broader market benchmark, you're getting nearly identical returns, but with just a tiny fraction of the historical pain. To put that into perspective, consider the baseline. Sitting deep down in the pain zone. The S&P 500 benchmark shows a terrifying historical maximum draw down of negative 24% for this modeled period. Just imagine having to stomach a quarter of your life savings vanishing into thin air right when you need it most. That is the harsh reality of simply writing the market without a parachute. But by physically rising above that volatility, the conservative models completely rewrite the script. They sit safely at the very peak of the chart with incredibly low historical draw downs. Literally just -3 to 5%. It's amazing. It proves you don't actually have to stand directly in the line of fire to stand the market. and achieve your required growth. And ultimately, this brings us to the core philosophy of algorithmic fire. Achieving financial independence isn't about finding the fastest car on the track. It's really about building the one that never crashes. You need a reliable, highly efficient engine that can withstand the absolute worst market conditions while still carrying you smoothly toward your destination. So, as we wrap up this explainer, I'm going to leave you with this final thought. Grab your own financial GPS, check your coordinates, and ask yourself where exactly does your portfolio sit on the efficient frontier today? And honestly, more importantly, is it truly ready for the retirement pivot?

Disclaimer

For Educational Purposes Only: All content on this site, including articles, tools, and simulations, is for informational and educational purposes only. It should not be construed as financial, investment, legal, or tax advice. The information provided is general in nature and not tailored to any individual's specific circumstances.

Software Development Has Inherent Risks: The software used to perform the analyses may have errors or inaccuracies. When we post updates to any material, errors or inaccuracies that are subsequently fixed may change the results.

No Guarantees & Risk of Loss: The analyses and simulations presented are based on historical data. Past performance is not an indicator or guarantee of future results. All investing involves risk, including the possible loss of principal. Market conditions are subject to change, and the future may not resemble the past.

No Fiduciary Relationship: Your use of this information does not create a fiduciary or professional advisory relationship. We are not acting as your financial advisor.

Consult a Professional: You should always conduct your own research and due diligence. Before making any financial decisions, it is essential to consult with a qualified and licensed financial professional who can assess your individual situation and objectives. We disclaim any liability for actions taken or not taken based on the content of this site.

Data Sources & Attribution: This site utilizes the FRED® API provided by the Federal Reserve Bank of St. Louis. This product uses the FRED® API but is not endorsed or certified by the Federal Reserve Bank of St. Louis. All FRED® data is used strictly for internal analytical processing and research.

Third-Party Links & Endorsement: This site contains links to third-party websites and resources for your convenience. We have no control over the content, privacy policies, or practices of these sites. The inclusion of any link does not imply endorsement, sponsorship, or recommendation by Algorithmic Fire LLC. We are not affiliated with any third-party sources unless explicitly stated, and we disclaim any liability for information or services provided on these external platforms.

Nobody associated with Algorithmic Fire LLC has any credential(s) or affiliation(s) with any licensing or regulatory bodies, including but not limited to: Securities and Exchange Commission (SEC), Financial Industry Regulatory Authority (FINRA).

Copyright 2025-2026 Algorithmic Fire LLC. All rights reserved.