🎉
Summer Launch Special: Get 1 month free. Use code SUMMER_2026_1_MONTH at checkout.

Does Using a Safe Withdrawal Rate Mean I Likely Die With No Money?

No. Conservative withdrawal math creates structural wealth accumulation in average and favorable market regimes.

📌 Summary & Key Takeaways

  • SWR Design Produces Structural Wealth Accumulation: Conservative withdrawal rates are calibrated to survive worst-case historical scenarios — which means in median and favorable market regimes, your portfolio compounds well above zero. At a 4.0% SWR with a 60/40 stock/bond benchmark (5.4% return, 9.4% StDev), Monte Carlo simulations show a 96.4% survival rate and a 71.0% probability of leaving more than $1.0M in remaining balance at the end of a 30-year retirement.
  • Historical Backtests Confirm Wealth Persistence: Across 816 rolling 30-year monthly cohorts (1928 to 1995) using a 50/50 stock/bond allocation, a 4.0% SWR achieved a 99.8% survival rate (814 of 816 cohorts survived). Among surviving retirees, the median ending balance was $1,191,199, with 57.2% of cohorts ending with more than $1.0M and 27.5% ending with more than $2.0M in real wealth.
  • The Retirement Conundrum Requires Active Management: The same risk buffer that protects your capital during severe market downturns will leave substantial unspent wealth in typical regimes. Adopting variable withdrawal strategies or periodic dynamic spending check-ins allows retirees to convert surplus portfolio gains into lifestyle income.

It is a common misconception that adopting a Safe Withdrawal Rate (SWR) framework to fund retirement income guarantees you will deplete your capital and die broke. The simulation math and historical data prove the opposite.

If you haven’t read my prior analysis on Sequence of Returns Risk and SWR Fundamentals, read those first. They cover the core simulation architecture, return distributions, and decumulation mechanics referenced below.


The Word “Safe” in SWR Is the Key

The mathematical definition of a Safe Withdrawal Rate is the maximum initial withdrawal percentage that survived extreme historical market shocks (such as the Great Depression or 1970s stagflation). Because SWRs are calibrated against severe tail-risk events, applying that same fixed withdrawal rate during average or bull market regimes causes portfolio wealth to compound rather than decay.


Simulated 30-Year Decumulation Outcomes

To test the distribution of final account balances under realistic return parameters, I ran a 500-run Monte Carlo simulation modeling a $1,000,000 starting portfolio over a 30-year retirement at a 4.0% SWR. The underlying asset mix assumes a 60/40 stock/bond benchmark allocation with an expected real return of 5.4% and annual volatility of 9.4%.
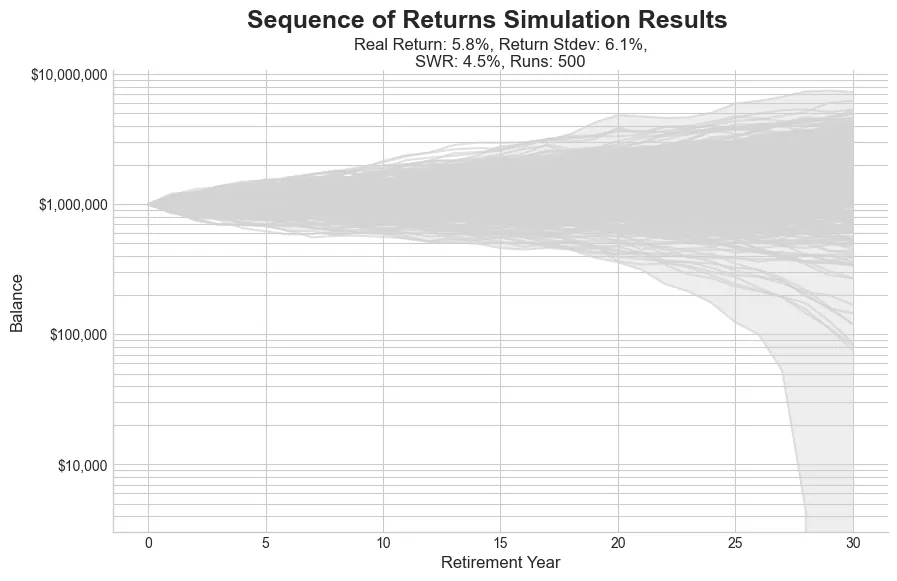
Multi-panel Monte Carlo decumulation trajectories and final wealth distribution for 4.0% SWR.
30-Year 4.0% SWR Monte Carlo Decumulation Trajectories & Final Wealth

Key Insights from Monte Carlo Simulations

  • 96.4% Survival Rate: Out of 500 simulated 30-year retirements, 482 succeeded cleanly while 18 runs encountered exhaustion prior to Year 30.
  • 71.0% Probability of Ending > $1.0M: 71% of simulated retirees finished 30 years with an inflation-adjusted balance higher than their initial $1,000,000 starting nest egg.
  • 40.6% Probability of Ending > $2.0M: In favorable return sequences, portfolio growth far outpaced withdrawals, yielding a median final wealth of $1,603,330 and 40.6% of runs exceeding $2.0M.

Historical Market Backtests (1928–1995 Cohorts)

While Monte Carlo models test randomized return paths, historical backtests evaluate how real market shocks (inflation spikes, market crashes, and prolonged stagnation) impacted actual decumulation trajectories.

I evaluated 816 rolling 30-year monthly cohorts from 1928 to 1995 using a 50/50 stock/bond allocation (100% S&P 500 equity sleeve paired with 5-Year U.S. Treasuries).
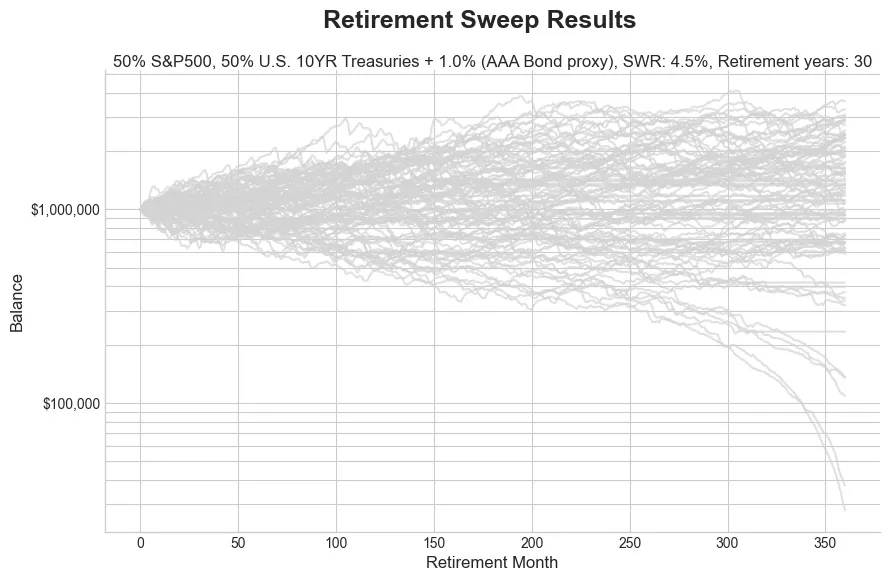
Real 50/50 stock/bond price index showing historical 4.0% SWR failure cohorts.
30-Year 4.0% SWR Historical 50/50 Real Return Index Overlay

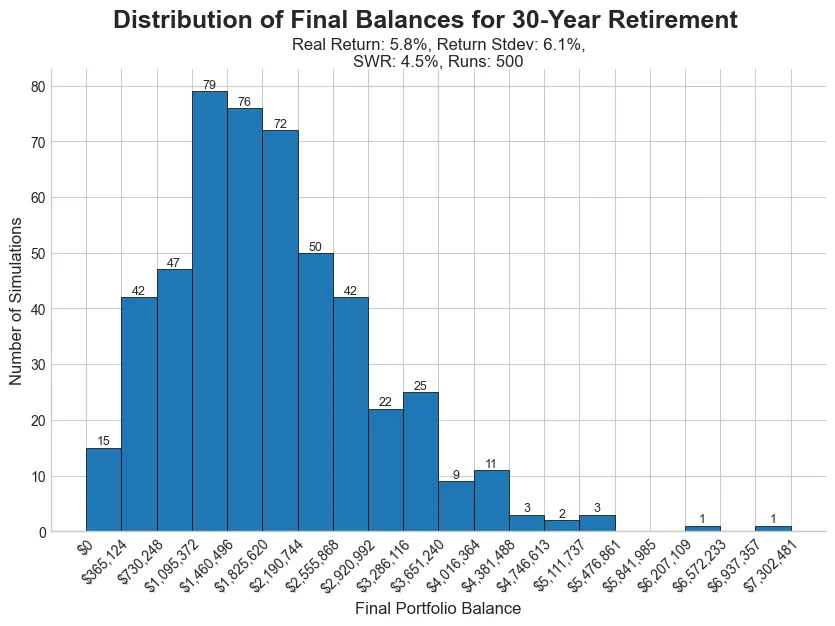
Multi-panel historical decumulation trajectories and final wealth distribution for 4.0% SWR.
30-Year 4.0% SWR Historical Decumulation Trajectories & Final Wealth

30-Year Historical Results

  • 99.8% Survival Rate: Across 816 rolling 30-year cohorts (1928 to 1995), a 4.0% SWR applied to a 50/50 portfolio achieved a 99.8% success rate (814 of 816 cohorts survived).
  • Failure Clustering: Failure cohorts (only 2 total months: 1965-05 and 1965-11) occurred exclusively during the absolute peak of the 1960s inflation/stagflation shock.
  • Significant Bequest Distribution: Among surviving historical cohorts, the median real balance at Year 30 was $1,191,199, with 57.2% of cohorts ending with over $1,000,000 and 27.5% ending with over $2,000,000 in unspent real purchasing power.

Is This Success or Failure?

Finishing a 30-year retirement with double or triple your starting capital presents a classic financial paradox:

  • Risk Mitigation: The safety buffer required to protect against a 1929 or 1966 worst-case scenario ensures survival.
  • Under-Consumption Drag: If economic worst-case scenarios do not occur, a fixed SWR forces you to consume significantly less than your portfolio could have safely supported.

Key Takeaways & Action Plan

  1. Plan for Inheritance or Philanthropy: Recognize that using a conservative SWR makes leaving a substantial estate highly likely. Work with an estate attorney to establish trusts or legacy plans early in retirement.
  2. Conduct Periodic Guardrail Check-Ins: Every 5 to 10 years, re-evaluate your actual withdrawal percentage against your current portfolio value. If strong market performance has dropped your effective withdrawal rate below 3.0%, you can safely step up income.
  3. Avoid Annual Reactionary Increases: Do not raise baseline withdrawals after every strong market year. Compounding during bull years builds the essential buffer required to survive future market downturns.
  4. Transition to Dynamic Spending Strategies: Adopting dynamic spending framework rules (such as floor-and-ceiling guards or variable withdrawal rates) allows you to capture upside gains during strong markets while maintaining downside protection during crashes. Read my follow-up analysis on Variable Withdrawal Rates for actionable implementation strategies.

Watch the Video Summary

Prefer video format? Watch the summary on our dedicated player page (6:41).

Watch Video Summary →

Frequently Asked Questions

No. A Safe Withdrawal Rate (like the 4% rule) is designed to ensure you don't run out of money in the worst-case historical scenarios. In the vast majority of average or good market scenarios, retirees using a reasonable and tested SWR actually end up dying with significantly more money than they started with.

Because the 4% rule is calibrated for the worst 5% of historical market sequences (like retiring right before the Great Depression). If you happen to retire during a normal or bull market, your portfolio will grow much faster than your 4% inflation-adjusted withdrawals deplete it.

A variable withdrawal rate dynamically adjusts your spending based on how the market performs. Instead of blindly taking out 4% adjusted for inflation every year, you take out more when the market is up and tighten your belt when the market is down.

Continue Your Research


Thanks for reading! Feel free to share this post, and follow us on social media:

X Yahoo Finance Share
Paul Dunn Profile
Written by Paul Dunn

Founder & Lead Engineer at AlgorithmicFIRE

Paul Dunn applies software engineering and data analysis principles to retirement planning. As a data engineer, he designs quantitative simulators (Monte Carlo, SWR sweep, tax optimizers) to verify portfolio longevity against historical and statistical cycles.


View Video Transcript

So, what if I told you that for most people, the biggest financial risk in retirement isn't running out of money, but actually having way too much. I know it sounds like a pretty great problem to have, right? But as we're about to see, it comes with its own set of really surprising challenges. You know, this is the big fear that drives so much of our financial planning, isn't it? That nightmare scenario where you save your entire life, you follow all the rules, and then you watch your account balance just hit zero, right when you need it the most. Does playing it safe really mean you're cutting it that close? Well, the data tells a completely different story. The answer is a huge emphatic no. For most folks who follow a standard safe retirement strategy, the most likely outcome isn't dying broke at all. It's leaving a substantial fortune behind. We're talking a whole second nest egg for your kids or maybe a big donation to a cause you really care about. So, what's going on here? Why is there this massive disconnect between our biggest fears and what the data actually shows? Let's peel back the layers on what we could call the great retirement money myth. The key to understanding all of this comes down to one simple concept. The safe withdrawal rate or S SWR. Now, this isn't just some optimistic guess about how much you can spend. No, no. This is a battle tested strategy that's been designed to survive the absolute worst financial storms you can imagine. Think the Great Depression, the.com bust, all of it. It's built on a mountain of real history and computer models to make sure your money lasts. And because it's built to be so safe, it has some really surprising side effects. To see what I mean, let's start by looking at what thousands of computer simulations of retirement portfolios actually show us. And honestly, the results might just blow you away. Okay, so what you're looking at here, yeah, it kind of looks like a mess of spaghetti, right? But each one of those gray lines is a possible 30-year retirement journey for a $1 million portfolio. This single chart shows 500 different simulated futures. Some of them shoot way up, others take a scary dip, but it just perfectly shows you the huge range of what could happen. That spaghetti chart is a little wild, I'll admit. So, let's bring some order to that chaos. This slide takes all 500 of those final balances and sorts them into a nice, simple histogram. This makes it so much easier to see where most people are actually likely to end up after 30 years. And boom, here's the core takeaway. What's the chance you end your 30-year retirement with more than the $1 million you started with? A whopping 79.2%. Just let that sink in for a second. In nearly four out of every five simulations, the portfolio didn't just survive, it actually grew. So, what does safe really mean here? Well, out of those 500 different simulations, each with its own crazy set of market twists and turns, only one, just a single one, ran out of money before the 30-year mark. That one failure represents a truly disastrous, historically rare string of bad luck. That's just how powerful that built-in safety buffer really is. Okay. Okay. So, simulations are one thing, but they aren't real life. I get it. So, let's shift gears and see what happens when we stop simulating and start looking at what has actually happened in real world market history. Now, this chart might look a lot like the first one, but it's totally different. This is based on real life. Each line here represents a 30-year retirement that started in a different month in actual US market history going back decades. This is the ultimate stress test, showing how the strategy would have held up through actual wars, recessions, and boom. And when we organize all of this historical data, just like we did with the simulations, a very familiar pattern shows up. Now, the outcomes aren't quite as wildly optimistic as some of the simulations, you know, reality tends to be a bit more grounded, but the main message is exactly the same. Success is the rule, not the exception. So, how much extra money are we talking about? Well, based on real world history, you would have had a 21.8% 8% chance. That's more than one in five of passing away with over $2.1 million from that initial $1 million portfolio. That's not just a surplus. That's a massive surplus. And this is where things get really, really interesting because now we have to ask an almost philosophical question. We've proven these plans are incredibly successful at not running out of money. But is that the only way we measure success? Or could this kind of success actually be its own weird form of failure? There's a pretty powerful argument out there that goes something like this. Dying with a huge bank balance is a failure. That money could have been used to live a richer life, you know, to create more experiences, to give more to your family, to just reduce your stress. But instead, it just sat there unused. And that's the central puzzle of retirement planning. It's kind of like packing for a trip to the desert. You bring all this extra water, a satellite phone, a flare gun just in case. But if you have a perfectly normal, boring trip, you end up just carrying a lot of extra weight you never needed. That's exactly what's happening with our retirement money. So, if having a big surplus is the most likely outcome, what do you do about it? You can't just ignore it. So, let's talk about how to actually plan for this problem. The source material suggests a pretty straightforward two-step approach. First, make a legacy plan and do it early. Don't let that surplus be an accident. Decide with intention where you want that money to go to your family, to causes you care about, and then work with a pro to make it official. And second, review your plan every so often. Say every 8 to 10 years. If the markets have been good and your portfolio has grown a lot, it might be time to sit down with an adviser and re-evaluate things. The whole point is to make sure your surplus has a purpose. Now, before we wrap up, I have to give you the single most important warning. Please do not take this information as a green light to just start spending more every time you have a good year in the market. That surplus, that buffer, that is the very thing that makes the safe withdrawal rate safe. If you start chipping away at it, you undermine the whole strategy. So, at the end of the day, we plan so we don't run out of money. It's the smart, responsible thing to do. But all this data really begs a deeper question, doesn't it? What if the real goal of all this planning isn't just to not run out of money, but to make sure we don't run out of life? Definitely something to think about. Thanks for joining me.

Disclaimer

For Educational Purposes Only: All content on this site, including articles, tools, and simulations, is for informational and educational purposes only. It should not be construed as financial, investment, legal, or tax advice. The information provided is general in nature and not tailored to any individual's specific circumstances.

Software Development & Data Processing Risks: The software used to perform the analyses may have errors or inaccuracies. When we post updates to any material, errors or inaccuracies that are subsequently fixed may change the results. Historical pricing revisions, corporate actions, or algorithmic optimizations may dynamically recalculate past simulation timelines. As a result, past signal sequences shown on this site or in digests may shift retroactively to align with the revised data.

No Guarantees & Risk of Loss: The analyses and simulations presented are based on historical data. Past performance is not an indicator or guarantee of future results. All investing involves risk, including the possible loss of principal. Market conditions are subject to change, and the future may not resemble the past.

No Fiduciary Relationship: Your use of this information does not create a fiduciary or professional advisory relationship. We are not acting as your financial advisor.

Consult a Professional: You should always conduct your own research and due diligence. Before making any financial decisions, it is essential to consult with a qualified and licensed financial professional who can assess your individual situation and objectives. We disclaim any liability for actions taken or not taken based on the content of this site.

Data Sources & Attribution: This site utilizes the FRED® API provided by the Federal Reserve Bank of St. Louis. This product uses the FRED® API but is not endorsed or certified by the Federal Reserve Bank of St. Louis. All FRED® data is used strictly for internal analytical processing and research.

Third-Party Links & Endorsement: This site contains links to third-party websites and resources for your convenience. We have no control over the content, privacy policies, or practices of these sites. The inclusion of any link does not imply endorsement, sponsorship, or recommendation by Algorithmic Fire LLC. We are not affiliated with any third-party sources unless explicitly stated, and we disclaim any liability for information or services provided on these external platforms.

Regulatory Status: Algorithmic Fire LLC is not a registered investment adviser, broker-dealer, or financial planner, and is not affiliated with the Securities and Exchange Commission (SEC) or the Financial Industry Regulatory Authority (FINRA). The content, tools, and simulations provided on this site do not constitute, and should not be construed as, professional financial advisory services.

Copyright 2025-2026 Algorithmic Fire LLC. All rights reserved.