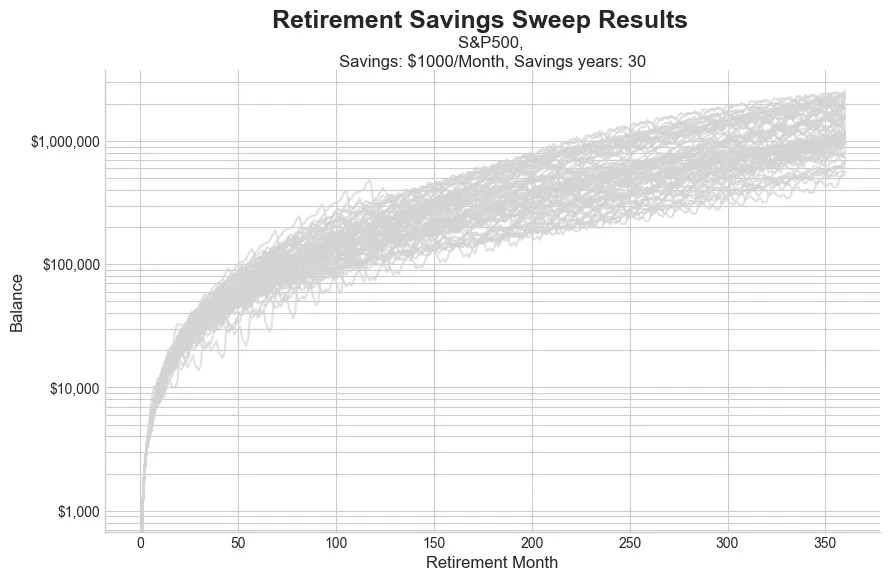
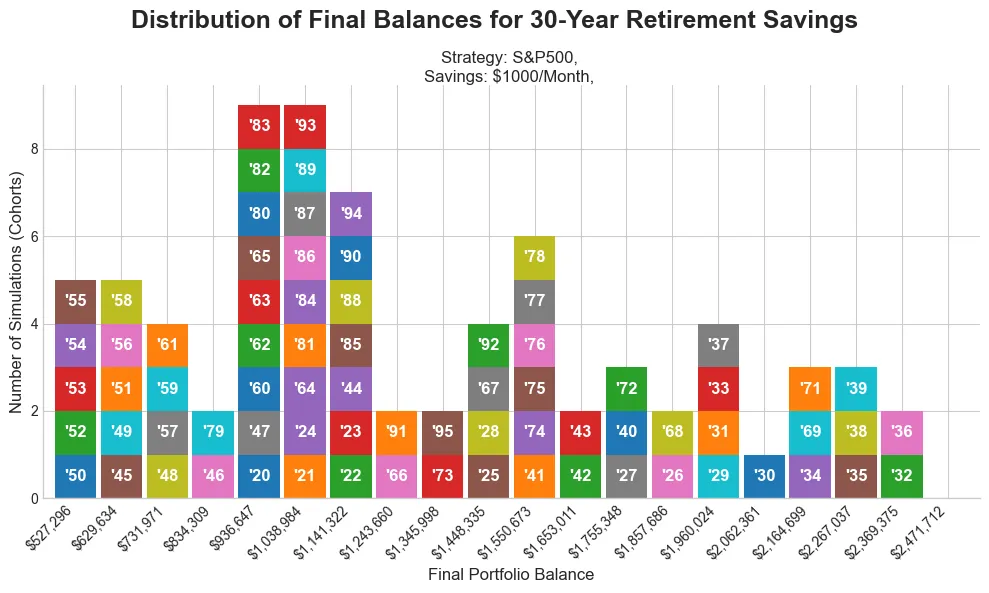
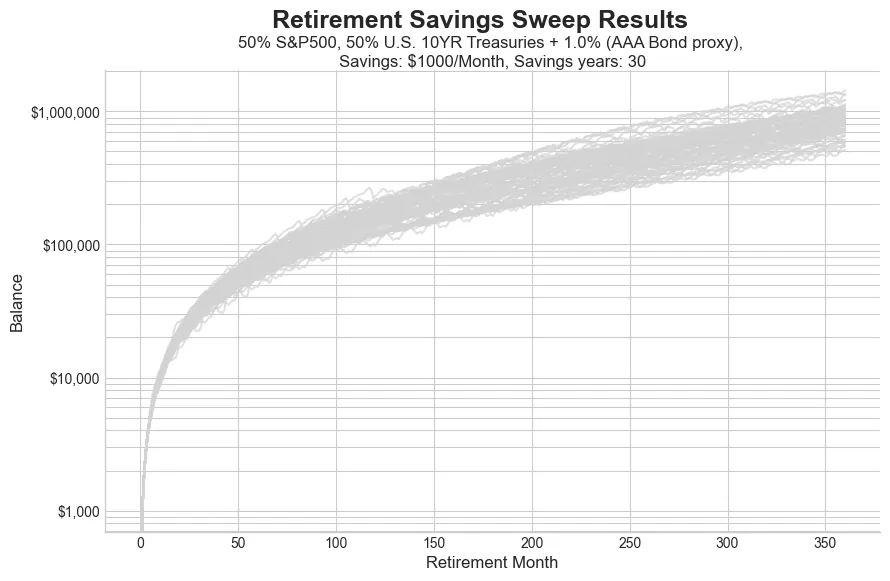
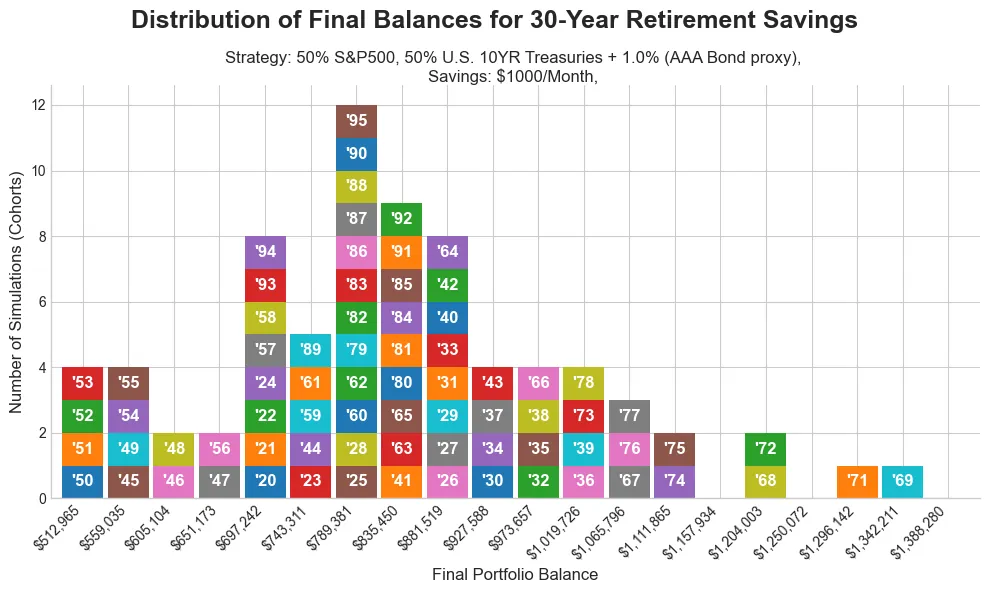
You know, so many of us share this common goal, right? We save for decades trying to build up enough to have a really comfortable retirement. We punch numbers into those online calculators. They spit out a nice neat target number and we aim for it. But what if I told you that one of the biggest, and I mean biggest factors in how much you end up with is something you have absolutely zero control over. Today, we're going to dig into the wild, surprising role that pure, simple luck plays in your retirement. So, let's start with a really straightforward question. Imagine you are super disciplined. You save $1,000 every single month for 30 years straight. No exceptions. Does that make you a millionaire? You know, the common wisdom and a lot of the tools you find online, they'd have you believe the answer is a simple resounding yes. But as we're about to see, the real answer is, well, it's a whole lot messier than that. So, first, let's just look at that simple promise. The one that assumes everything is smooth sailing, a nice predictable journey to becoming a millionaire. Okay? So, if you assume a constant steady return of 7% a year after inflation, which is a pretty common benchmark people use, then yeah, after 30 years of tucking away a grand a month, you'd end up with a cool 1.2 million bucks. It's clean, it's encouraging, and honestly, it's the number that a whole lot of financial advice is built on. But here's the thing, and we all know this intuitively, right? The market doesn't just hand you a neat 7% every year like clockwork. Oh, no. It zigs, it zags, it booms, and then it busts. And all that messiness, that volatility, it completely changes the game. And this brings us to the absolute heart of the matter. The massive role that pure luck plays in all this. It's not just about how much you save. It turns out it's just as much about when you happen to be saving it. All right, take a look at this. It might look like a plate of spaghetti, but what you're seeing is a historical simulation. Every single one of those gray lines, that's a person saving $1,000 a month for 30 years invested in the S&P 500. The only thing that's different between all of them, the year they started saving. It's just incredible. This chart shows some people just barely squeaking over the million-dollar line, while others are way, way up there, all for following the exact same plan. So, let's try to unpack these crazy results a little more. We'll start by focusing on this all stock portfolio. You know, the high-risk, highreward approach. Now, this is where it gets really fascinating. This chart organizes all that chaos. It's what's called a histogram, and it shows the final portfolio balances. And see those little numbers in the boxes? Those are the start years for each 30 years saving journey. You can see it right away. Look at the far left. Those are the unlucky savers, the folks who happen to start in the early 1950s. And then look all the way to the far right. Those are the luckiest ones who had the incredible good fortune to start saving in the late 1930s. And the difference between them is just staggering. I mean, the unluckiest saver, who did everything right, followed the plan to a te and did their 30 years with just $527,000. Meanwhile, the luckiest saver, following the identical strategy, retired with over $2.4 million. Wow. Let me just put that another way so it really sinks in. The luckiest person ended up with 4.6 times more money than the unluckiest person. Think about that. same savings, same discipline, same investment. The only difference was a different roll of the dice on what year they happen to be born and start their career. So, if going allin on stocks is such a roller coaster, what about playing it a little safer? You know, can we tame some of that wildness by diversifying a bit? Let's see what happens. So, to test this, the source material ran the exact same simulation, but this time with a more conservative portfolio. It's a classic, a 50/50 split. half your money in stocks, the other half in highquality corporate bonds. The whole idea here is that the bonds are supposed to smooth out the ride when the stock market gets choppy. And this sideby-side comparison just illustrates the effect perfectly. On the left, you've got the all stock portfolio we were just looking at. On the right, the new 50/50 portfolio. You can see it immediately, right? The results on the right are much more bunched up. Those crazy multi-million dollar wins are gone, but all the outcomes are a lot more clustered together in the middle. Okay, let's put some hard numbers to that. So, yeah, diversifying it did exactly what you'd think. It lowered the ceiling. The absolute best case scenario dropped from 2.4 million down to 1.4 million. The median or kind of the typical outcome also fell from over 1.2 million to about $843,000. But, and this is the real kicker, look at the worst case scenario, it barely moved. The unluckiest all stock saver ended up with $527,000. the unluckiest 50/50 saver. They ended with $513,000. So, playing it safe didn't really save you from the absolute worst luck of the draw. So, what in the world is the takeaway here? I mean, if even a safer strategy can't totally protect you from a bad roll of the dice, how are we supposed to approach planning for our own retirement? Well, it really brings two of the oldest warnings in finance into sharp focus. You've heard them a million times. Past results are not indicative of future results. And my personal favorite, your mileage may vary. This historical data, it isn't a crystal ball. Think of it more like a map that shows the huge, huge range of possible destinations you could end up in, even if you follow the exact same road as everyone else. And that leads us to what is probably the single most important lesson from all of this. Don't don't anchor your entire financial future to a single average number that a calculator spits out. History shows us that our saving careers are, you know, relatively short and the 30 years we get might not look anything like the long-term market average. So, the crucial thing is this. Plan for a range of outcomes. Yeah, hope for the best, but you have to prepare for outcomes that could be substantially different and maybe a lot lower than the average. Because when it's all said and done, the only thing you can truly control is how you plan for that uncertainty.