U.S.-Based Investors Think the Worst-Case Scenario is the Great Depression or GFC. Other Countries Disagree.

When investment planning for retirement, it is important to consider all possible outcomes. We take a look at Japan in the 1990s to redefine "worst case".
Video Included

Video Summary

U.S.-based investors have had it quite good, for a long time. As we showed in our post “Safe Withdrawal Rate Failure”, using a fixed Safe Withdrawal Rate (SWR) of 5% and a 50%/50% stocks/bonds allocation would have been successful, except for retirements starting in: 1937, 1962-69 (most years), 1973, and 2000.

If you had used a 4.5% SWR with the same portfolio, there were zero failures.

image_1.png

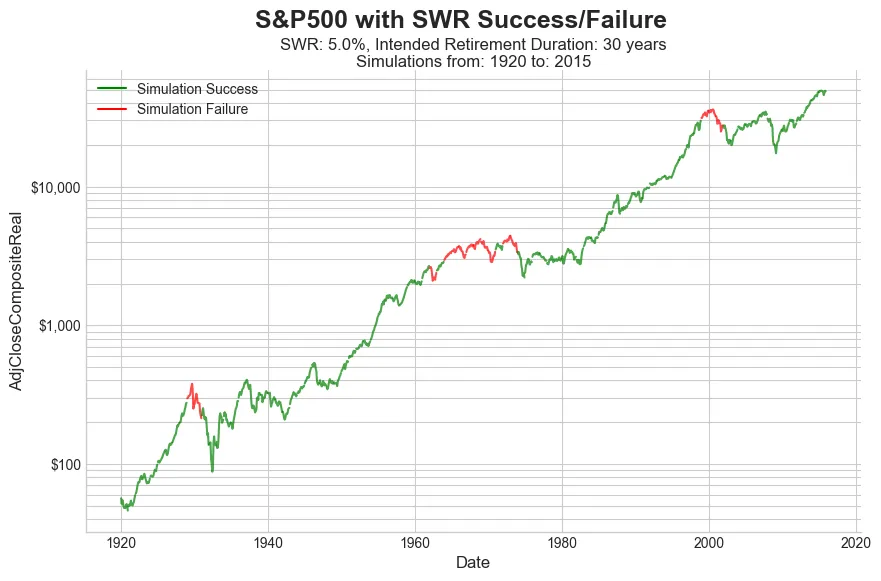
Even if you were 100% stocks with a 5% SWR, there were only a few more failing years. (See above chart.) This has left U.S.-based investors confident in general, and confident in U.S. stocks in particular.

This historical data, or statistics derived from it, are used in models to determine Safe Withdrawal Rates. Thus the 4% Rule, now the 4.5% Rule, doesn’t fail against the prescribed 50/50 (stock/bond) portfolio. But does this data really represent a proper range of scenarios, including worst case?


It can be worse - Japan in the 90s

image_2.png

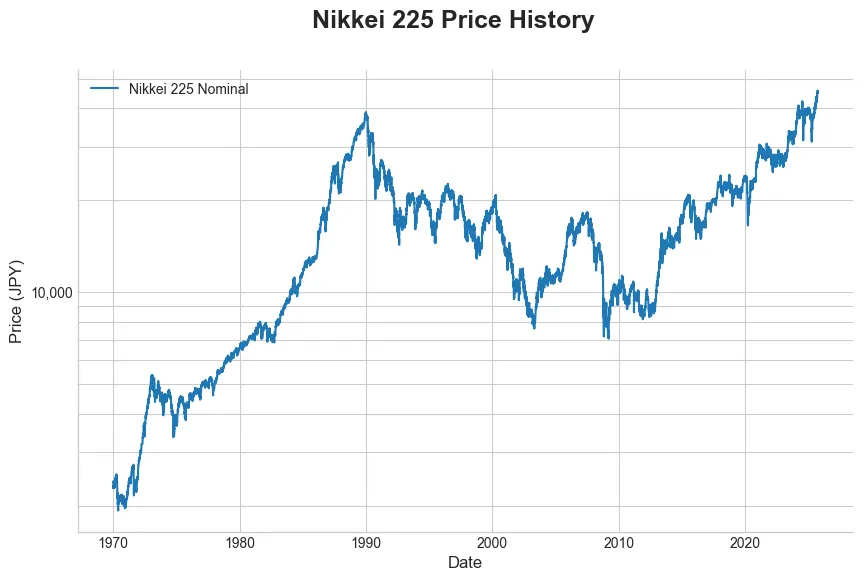
The chart above shows the Nikkei 225 (JAN 1970 - SEP 2025). The Nikkei 225 is roughly the Japanese equivalent of the S&P 500, as it is the most prominent stock index tracking major Japanese companies on the Tokyo Stock Exchange, serving as a key economic barometer. (The Nikkei 225 and S&P 500 differ significantly in calculation as the Nikkei 225 is price-weighted, while the S&P 500 is market-cap weighted.)

The obvious problems:

  • The index peaked in December 1989 at ¥38,915, and didn’t see that level again until February 2024.
  • The chart is nominal price; not inflation adjusted. That 1989 level represents about ¥47K in today's Japanese Yen. Thus, in real terms, the index only regained its 1989 peak in October 2025.
  • From 1/1992 to 1/2020, the index averaged ¥15418, or 39% of its peak.
  • It reached a low of ¥7054, or 18% of its peak.

Retirement Scenario Results

We are going to use the investment returns of the Nikkei 225, and treat them like a U.S.-based investor had this same return, just to show how a scenario like this plays out for retirement.

Let’s take an optimistic scenario. A person retires in January 1985, well prior to the peak. They believe in stocks, and thus stay invested 100% in stocks. They have 5 years where the account goes up over 200% (a factor of 3.12). That is an INCREDIBLE start; who could ask for better.

Yet, the results are bleak:

  • With a 5% fixed withdrawal rate. Balance hits zero in 2004; retirement lasted 19 years.
  • With a 3% fixed withdrawal rate. Balance hits zero in 2011; retirement lasted 26 years
  • With a 2% fixed withdrawal rate. Balance hits a low of about $90K in 2012, then recovers to about $120K in 2015 when the 30 year retirement ends. Just made it...

    • Even though the index is recovering strongly after 2012, a longer retirement would have ended with $0 in 2022; the significant gains just weren’t enough on the reduced balance.
  • All that, and this was a scenario for retirement starting in 1985. Anyone retiring between 1985-1990 had it much worse.

Just to be clear on those results - it took living off of only 2% of the portfolio to last a 30 year retirement.


What would you have done?

It is valuable to contemplate such a scenario and ask yourself “what would I have done?”.

  • You might think that not being 100% in stocks would have fixed it, but the results hardly change due to the huge run-up at the start of retirement that you would have missed in a mixed portfolio.
  • Go to international stocks? The 1990 Nikkei collapse was isolated to the Japanese market. But the downturn in the Nikkei in 2000 was the dot-com bust, and in 2008 the GFC took all markets with it.

    • This is an example of really unfortunate timing. The local (Japanese) market collapses, then a decade later there are 2 market setbacks that are worldwide.

Takeaways

What can we learn from this?

  • ~~Buy the dip!~~

    • Not every dip is a buying opportunity. It will work sometimes, otherwise you are trying to catch a falling chainsaw and it will take your hands off.
  • ~~“It’s different this time, valuations don’t matter”.~~

    • That was literally being said at the time about Japanese asset prices; both stocks and real estate.

    • Valuations matter. Maybe not today, or next month, but at some point they will matter again.

  • Buy and hold is appropriate for someone with very long time horizons. But your retirement may be shorter than the long term that justifies buy and hold.

  • We are advocates for having a strategy to get out of stocks in such circumstances. There are different strategies, we will discuss that in a future post(s).

Last it is important to point out that most retirement calculators, safe withdrawal rate models, etc., don’t account for a scenario like this. Maybe this is an extreme case, and they shouldn’t account for a scenario like this. But it is important to know that even in recent history, in an advanced economy, asset collapses do happen.

Did we mention AI, or current U.S. asset prices? No. Our intention is not to debate the current situation, but just post a reminder that asset bubbles can happen, have happened not long ago, and they were driven with the same “but this time is different” or “valuations don’t matter” logic.

P.S. Wikipedia has a good write-up on the Japanese asset collapse. One of our favorite statistics from the era:

  • At their peak, prices in central Tokyo were such that the 1.15 square kilometer Tokyo Imperial Palace grounds were estimated to be worth more than the entire real estate value of California**”

Ready to learn more?

See a list of recent blogs on our home page.

Or, dive deeper into investing, saving, and withdrawal strategies through our comprehensive Curriculum.


Thanks for reading! Feel free to share this post, and follow us on social media:

Bluesky Yahoo Finance Share

Disclaimer

For Educational Purposes Only: All content on this site, including articles, tools, and simulations, is for informational and educational purposes only. It should not be construed as financial, investment, legal, or tax advice. The information provided is general in nature and not tailored to any individual's specific circumstances.

Software Development Has Inherent Risks: The software used to perform the analyses may have errors or inaccuracies. When we post updates to any material, errors or inaccuracies that are subsequently fixed may change the results.

No Guarantees & Risk of Loss: The analyses and simulations presented are based on historical data. Past performance is not an indicator or guarantee of future results. All investing involves risk, including the possible loss of principal. Market conditions are subject to change, and the future may not resemble the past.

No Fiduciary Relationship: Your use of this information does not create a fiduciary or professional advisory relationship. We are not acting as your financial advisor.

Consult a Professional: You should always conduct your own research and due diligence. Before making any financial decisions, it is essential to consult with a qualified and licensed financial professional who can assess your individual situation and objectives. We disclaim any liability for actions taken or not taken based on the content of this site.

Nobody associated with Algorithmic Fire LLC has any credential(s) or affiliation(s) with any licensing or regulatory bodies, including but not limited to: Securities and Exchange Commission (SEC), Financial Industry Regulatory Authority (FINRA).

Copyright 2025-2026 Algorithmic Fire LLC. All rights reserved.


View Video Transcript

Today we are going to talk about one of the holy grails of retirement planning, the 4% rule. For millions of people, it's the go-to rule for financial advice. But what if its entire foundation is built on a uniquely American success story that well might not hold up everywhere else? So, let's just jump right in with a big question. We all rely on history to plan for our future, right? But what if the history we're all using isn't really the worst case scenario. What if a much much tougher reality is possible even in a modern advanced economy like our own? Okay, so first let's talk about why this rule is so popular in the United States. Retirement planning models feel incredibly solid, almost foolproof. And that's because they're based on about a century of data that tells a very, very comforting story. And just look at this chart. You can see just how safe things look. This shows a 5% withdrawal rate simulated against almost 100 years of S&P 500 performance. And you see all that green? That means the retirement plan worked. You only see these tiny little specks of red where it failed. It gives you a real sense of security, doesn't it? And you know what? If you dial it back just a little bit, get a little more conservative, the picture gets even better. Drop that withdrawal rate to 4.5% and poof, the red just disappears. Based on US history, a 4.5% rule has a perfect 100% track record. It's like the ultimate security blanket for American retirees. But this is where we have to pump the brakes and ask a really important question. That whole feeling of safety is based entirely on the experience of one single country. A country whose history is defined by resilience, recovery, and an almost unstoppable upward march. So, is the American market with its incredible V-shaped recoveries from every single crash really the right benchmark for a plan that needs to survive anything? Or is it possible that US investors have just been really, really lucky? To figure that out, we need to look somewhere else. And that somewhere else is Japan. Starting around the 1990s, the Japanese market gives us a chilling counternarrative. It's a real world stress test that absolutely shatters some of our most basic assumptions about investing. And wow, this image just says it all, doesn't it? On the left, you've got the S&P 500. Sure, there are dips and crashes, but they're always followed by a powerful recovery to new highs. But on the right, that's Japan's NIK 225. It hits this unbelievable peak in 1989 and then it falls into a black hole for decades. There's no quick comeback. There's just nothing. And just so we're all on the same page here, the NICA25 is basically Japan's version of the S&P 500. It's the big one, the main index that tracks Japan's largest companies. Think about this for a second. Over 35 years, a full generation. That's how long it took for the NICA to get back to its 1989 peak after you account for inflation. A standard 30-year retirement plan wouldn't have even been long enough to see the recovery. And the crash itself was just savage. At its absolute lowest point, the index wasn't just down. It was practically wiped out. A staggering 82% below its peak. Just gone. Now, this wasn't a quick dip in recovery. For almost 30 years, from 1992 all the way to 2020, the index just sat there averaging only 39% of its old peak value. Can you imagine your retirement portfolio spending 28 years at less than half of what you started with? So, what would this actually feel like for a real person trying to retire? Let's run a little simulation and see what happens when a standard retirement plan runs headirst into a realworld catastrophe. And we're not even going to pick a bad time to retire. In fact, let's pick a perfect time. Let's say you retire in 1985. For the first 5 years, you're a genius. The market is on an absolute tear and your portfolio more than triples. You are feeling invincible. You literally couldn't ask for a better start. But then the bubble bursts and the results are just devastating. A 5% withdrawal rate. Your money is completely gone in 19 years. Okay, so what about a super safe 3% rate? Nope. You still run out of money in year 26. Only by dropping your withdrawals to a tiny 2% would you have barely scraped by for 30 years. Just let that sink in for a minute. A 2% withdrawal rate. That completely flips the script on how much you need to save. It basically means you need a nest egg twice as big as what the 4% rule tells you. All because the market never came back within a single human lifetime. So, what are the big lessons we can pull from this uh pretty sobering story? Japan's lost decades offer some really powerful, if uncomfortable, takeaways for anyone planning for the future. You know, a lot of the common investing advice we hear all the time would have led you straight to disaster. Buy the dip in Japan. That was like trying to catch a falling chainsaw for 20 years straight. Valuations don't matter. Yeah, that was the exact thinking that fueled the bubble in the first place. And buy and hold, it works, but only if the long term is longer than your actual retirement. And if you need any more proof of just how disconnected from reality things got, get this. At the peak of the bubble, the grounds of the Imperial Palace in Tokyo, just a small patch of land, were supposedly worth more than all of the real estate in the entire state of California. I mean, come on. That's the definition of insanity. So, let's boil this all down. What do we need to remember? First, not every dip is a gift from the market gods. Second, valuations always matter eventually. Third, your 30-year retirement might not be long enough for a long-term market cycle to play out. And maybe the most important lesson of all, we have to accept that these devastating multi-deade collapses can happen even in the most successful economies in the world. Which leaves us with one last pretty heavy question to think about. Look, the Japanese experience might be an outlier, an extreme case. But retirement planning isn't about preparing for the average day. It's about making sure you can survive the absolute worst day. So, does your plan account for a real decadesl long catastrophe? Or is it just planning for a temporary Americanstyle downturn?