Bob C., a friend of the channel, asked us, “Isn’t the 4% rule a bit antiquated? Does it still matter?”. Thank you, Bob, for the inspiration for this post, we hope this answers your questions. (If you have your own questions, please contact us at algorithmicfire@gmail.com we’re happy to do the work so you don’t have to.)
Newer Strategies
The 4% Rule is a specific method implementing a Safe Withdrawal Rate (SWR), more generally called a withdrawal strategy. Since its inception, alternatives have gained popularity.
- In 2006, the author of the 4% rule changed his recommendation to 4.5%. (Reference: 1)
There are three general types of withdrawal strategies that are widely discussed:
-
Fixed Withdrawal Strategies (FWS) - the 4% rule is one of these. The withdrawal rate is fixed when you start your withdrawals, only updated for inflation. (“Fixed” refers to the fact that the withdrawal rate is fixed in terms of real dollars; or dollars of constant purchasing power. The withdrawals are allowed annual inflation adjustment.)
-
Pros - You know your income, it doesn’t change.
-
Cons - As we discussed in our post “Does Using a Safe Withdrawal Rate Mean I Likely Die With No Money?“, this approach risks accumulating a large savings balance.
-
-
Percent of Portfolio Strategy (PPS): This strategy is simple; you take a fixed percent of the portfolio each year.
-
Pros - It is better at avoiding accumulation of wealth.
-
Cons - There is a significant chance of having income substantially lower than initially planned. This can be mitigated by adding a floor for the withdrawal amount.
-
-
Variable Withdrawal Strategies (VWS) - These build on the FWS and PPS by adding rules to allow changes in withdrawal rate; there are many variations. Commonly, they have your withdrawal rate increase or decrease in proportion to the investment return, capped at some amount each year. The changes in withdrawal rate may only occur if your actual withdrawal rate has gone above/below a “guardrail”.
- Pros/Cons - This method is really just a more extreme version of PPS, and its Pros/Cons are similarly more extreme.
Other Strategy Considerations
The original 4% Rule prescribed a portfolio of 50% stocks and 50% intermediate-term U.S. government bonds. More modern strategies are less prescriptive in both investment options, as well as model inputs like withdrawal rate.
Rate of failure is another input. The original 4% rule was based around a 0% failure rate assumption. Many modern methods are satisfied with much higher failure rates; read results carefully.
Types of Analysis
Before moving on, it is important to mention that when analyzing withdrawal strategies, there are two common methods:
-
Backtesting - (A.K.A Historical analysis) This method of analysis uses actual historical investment return data as the inputs to simulations to model effectiveness of any given withdrawal strategy.
-
Pros - You can model how a given strategy would have actually performed in the past, against difficult periods like the Great Depression and Great Financial Crisis.
-
Cons - There is very limited data. That, and people question how relevant data from the early 1900s is, as markets and regulatory requirements have changed greatly since then.
-
-
Monte Carlo - (A.K.A. statistical modeling) The core idea, named after the famous casino in Monaco due to its reliance on chance, is to run a model hundreds- or thousands-of-times, each time using different random values for the unknown variables (investment returns).
-
Pros - You can quickly model 1000s of unique scenarios.
-
Cons - It is not real data. It doesn’t answer the specific question “what if I had been using this prior to the Great Financial Crisis?”.
-
Thus, when you are presented with results from models of withdrawal strategies, you have got to understand: withdrawal strategy, type of analysis, failure criteria, and investment strategy used. All will impact the results.
Wait, Three General Types of Withdrawal Strategies?
The three withdrawal strategies previously listed are all actually variations on a single algorithm. That single algorithm can be defined:
- Pick a withdrawal rate used to determine withdrawals for the first period; periods will generally be one year.
-
Choose to allow the amount of withdrawals to be modified, or not.
- If the withdrawalal amount is not modified, this is FWS, otherwise it is PPS/VWS.
-
If the withdrawalal amount modification is enabled:
-
Each year, a percentage of the investment return is used to modify your withdrawal rate.
- The withdrawal rate modification may only occur if the actual withdrawal rate has crossed some high/low thresholds. These thresholds may be the same value, in which case withdrawal rate adjustments happen every period.
- The change in withdrawal rate may be limited to a maximum positive or negative value.
-
With that algorithm:
- Fixed Withdrawal Strategies (FWS) - disables the investment return modifier, and thus the withdrawal rate caps are irrelevant.
- Percent of Portfolio Strategy (PPS): sets the percent of investment return withdrawal rate modifier at 0, and no caps on withdrawal rate changes.
- Variable Withdrawal Strategies (VWS): sets the percent of investment return withdrawal rate modifier and caps. I.E. investment return withdrawal: 50%, positive cap: 5%, negative cap: 2.5%.
All of these seemingly different withdrawal strategies are really the same algorithm, with different input variables.
Performance of FWS vs. PPS vs. VWS
Below, we will analyze the three strategies.
Important modeling detail: With variable withdrawal strategies, your income may be reduced considerably. For the purpose of this post, we have limited variable strategies such that no withdrawal will be less than 90% of the initial withdrawal.
Full modeling details are at the end of the post.
Chart Description
For each model we will show the same two charts:
- Balance Trajectories - these plots show the account balance for each of the 500 runs; failing runs are shown in red.
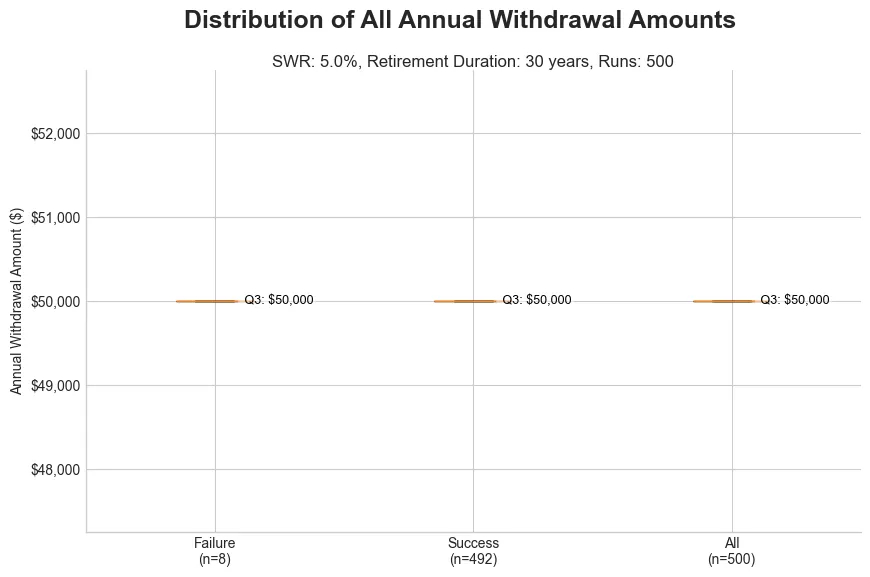
- Distribution of All Annual Withdrawal Amounts - These plots are box plots showing the range of withdrawals that occurred in all 500 of the runs; distributions are shown for failing runs, passing runs, and all runs.
- SWR is shown at the top of each plot; for PPS and VWS this is just the starting withdrawal rate, which is changing during the simulation.
Fixed Withdrawal Strategy (FWS)
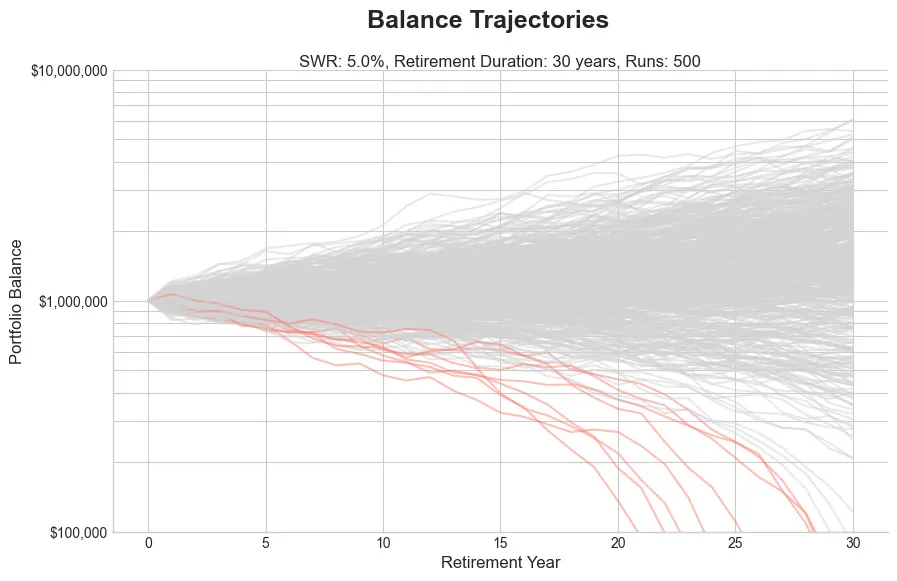
Key observations:
- There were 8 failures; success rate = 98.4%.
- The withdrawals are a constant value: $50K every year.
- The account value at the end of the simulation is frequently well over $2M, the range is: $0 - $6,093,122.
Percent of Portfolio Strategy (PPS)
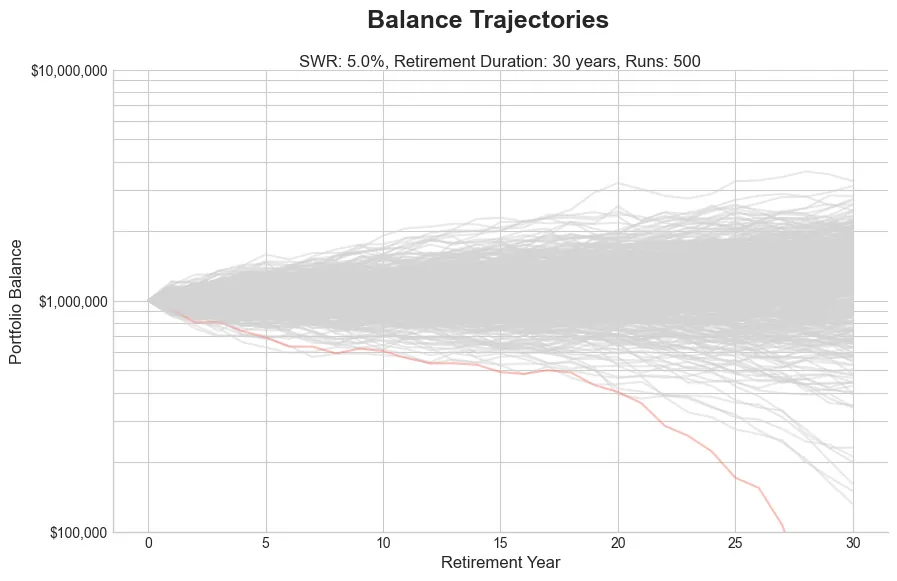
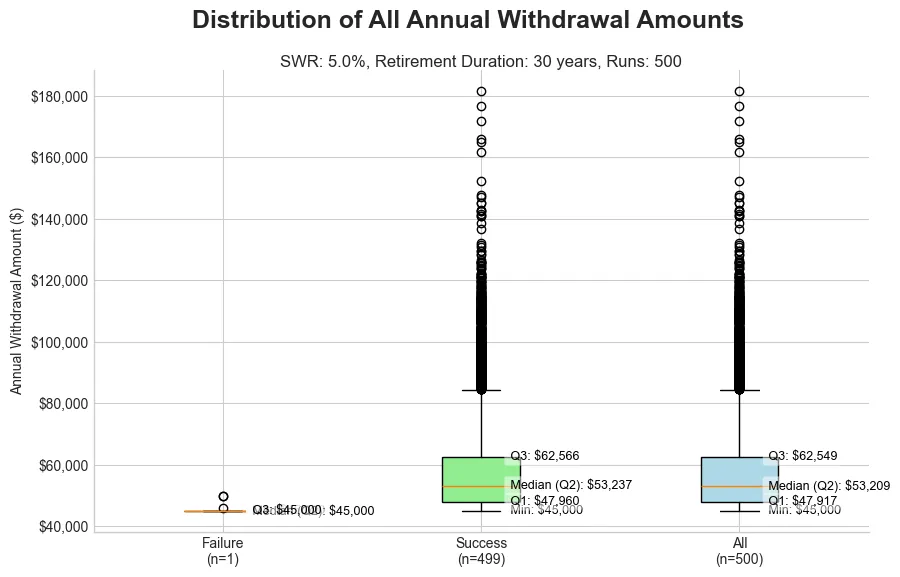
Key observations:
- There was one failure; success rate = 99.8%.
- The median annual withdrawal increased from $50K to $53K; there are some withdrawals well over $160K.
- The bottom quartile of withdrawals is between $45K-$48K; less than the initial withdrawal of $50K.
- The final balance range has been greatly reduced to $0 - $3,290,417.
Variable Withdrawal Strategy (VWS)
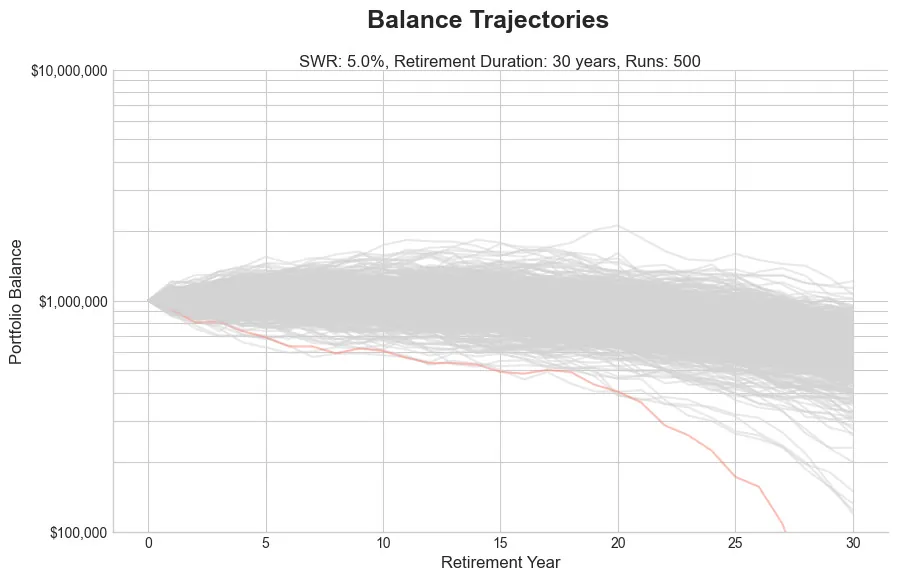
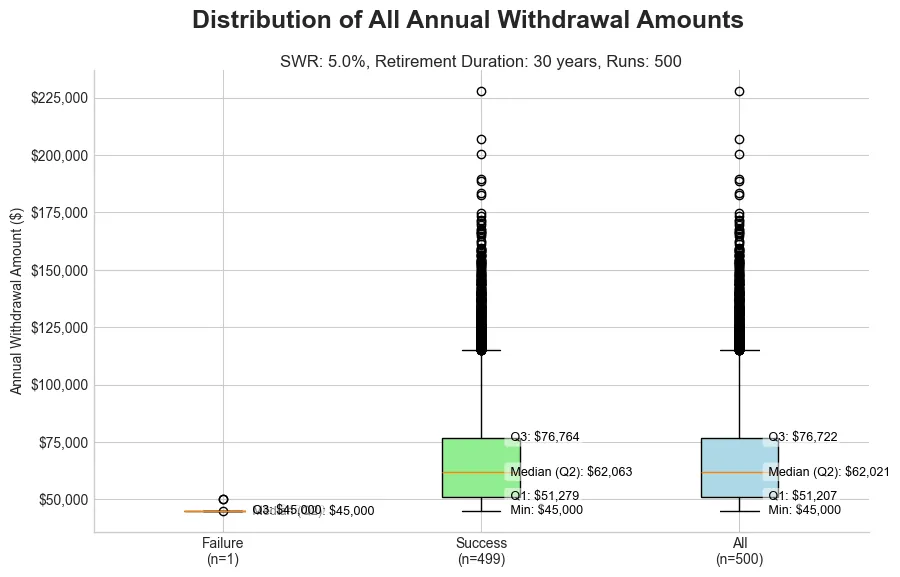
Key observations:
- There was one failure; success rate = 99.8%.
- The median annual withdrawal increased to $62K, from $50K (FWS) and $53K (PPS); there are some withdrawals over $200K.
- The bottom quartile of withdrawals is between $45K-$51K; less than the initial withdrawal of $50K.
- Triggering the failure was just barely avoided in several cases.
- The final balance range has been further reduced to $0 - $1,213,253.
Takeaways
- The models are not as different as they appear, and can generally be reduced to one algorithm.
- Fixed withdrawal strategies have the advantage of a fixed income amount, at the expense of a possible large range of final account balance.
-
Variable withdrawal strategies (PPS and VWS) will, on average, allow you to live off of a higher income AND reduce the range of final account balance, but there is a significant chance you will need to live off of less income than initially planned for some period. (Minimum withdrawal amount was fixed at 90% of the initial withdrawal in this model).
- Since the alternative to a 5% VWS, with similar success rate, is a 4.5% FWS, VWS seems like a clear winner; start higher, if it doesn’t work, cut back to the income an FWS would have provided.
The King Is Dead! Long Live The King!
So the 4(.5)% Rule may be dead, but the thing that replaced it is pretty much the same thing; the differences are values of the inputs to the models, portfolio selection, and what you consider failure.
-
The 4(.5)% Rule is still a great starting point for determining if you are nearing being financially ready to retire.
- Note that all the cases modeled in this post started with a 5.0% withdrawal rate, because higher withdrawal rates increase failure rates.
-
If failure is income below what you initially determined, the 4(.5)% rule still works well.
- If failure is passing with a very high account balance, and you are comfortable with possibly living off less than initially planned, then a variable strategy will suit you better.
Also consider a mixture of strategies. I.E. start with FWS to guarantee income early in retirement. Then if you do see your balance accumulate significantly later in retirement, switch to a variable strategy where, even if you wind up on a “reduced income” path, your income is still acceptable.
Model Details
We wanted to get straight to model results, but here are details on the modeling for those interested.
General model inputs:
- The model is a Monte Carlo simulation with 500 runs, where each run models one 30 year retirement based on random samples of investment returns matching the designated portfolio.
- Portfolio of 50% stocks and 50% investment grade corporate bonds.
- The account starts with $1M.
- Retirement lasts 30 years.
-
Failure is if the withdrawal amount goes below 75% of the initial withdrawal amount, or the account balance drops below 5% of the initial balance.
- Failure criteria is probably what differentiates these models the most. With FWS, all that matters is the account doesn’t run out of money. With variable strategies, you may not run out of money, but you also may not be happy with substantially reduced income.
Model specific inputs:
- FWS - 5.0% withdrawal rate based on initial portfolio value; I.E. withdrawals are always $50K every year.
-
PPS - 5.0% withdrawal rate based on actual account value.
- Withdrawals amounts are variable but limited to at least $45K (90% of the initial withdrawal amount).
-
VWS - 5.0% initial withdrawal rate. Each year the half of the investment return value is used to adjust the withdrawal rate for the next year. (I.E. if there is a 8% investment return, the withdrawal rate is increased 4%. Similar for negative returns.)
-
Withdrawal amount changes are capped at +5%/-2.5%
-
Withdrawals amounts are variable but limited to at least $45K (90% of the initial withdrawal amount).
-
Algorithm Description
- Starting withdrawal rate of 4.5%.
-
Each year that your investment return is positive, your withdrawal rate increases 50% of the investment return gain up to a maximum of 5% change in withdrawal rate.
- I.E. your investments have a real return of 10%, your withdrawal rate is allowed to increase 5% (50% of the 10% investment return). In this case, that increase in withdrawal rate is the maximum allowed.
-
Similarly, if investment return is negative, your withdrawal rate decreases by 50% of the (negative) return and is capped at a 2.5% reduction.
- (The above caps are picked to try to allow you to enjoy gains, while not reducing income too far from the initial plan.)