📌 Summary & Key Takeaways
- Capital Floor Exposes Hidden Risk in "Safe" Portfolios: Standard 4% rule models measure mathematical solvency ($0 balance), ignoring retiree capitulation. Under a behaviorally realistic Capital Floor (requiring real wealth to stay above 60% of principal early in retirement), 1970s cohorts holding 5-Year Treasuries experienced a 25.0% failure rate despite showing zero $0-balance bankruptcies.
- Long Duration Is a Stagflation Trap, But Credit Yield Buffers: 20-Year Treasuries collapsed to a median survival of 10.21 years in the 1960s (vs. 15.46 years for 5-Year Treasuries) and suffered a 40.8% failure rate in the 1970s. Conversely, 5-Year Moody's BAA Corporates improved 1960s median survival to a full 40 years (62% pass) because higher yield buffered inflation.
- Dynamic Trend-Following Controlled 1960s Failures Across All Bond Types: Applying ER_MMA trend-following to both sleeves achieved 40-year median survival for all bond types in the 1960s (with Corporate variants reaching 100% full pass) by rotating into T-Bills during rate-hike cycles to defend bond capital.
In my prior post, I replicated Bill Bengen's classic 4% rule. Bengen was specific about the bond component: intermediate-term U.S. Treasuries with roughly a 5-year maturity. In practice, however, many investors following the 4% rule hold something different — bond index funds with longer effective durations, corporate bond exchange-traded funds (ETFs), target-date funds, or high-yield bond sleeves — often without considering how that choice changes the underlying risk profile.
During the replication work for that post, I found that Safe Withdrawal Rate (SWR) outcomes are remarkably sensitive to which bonds you hold. The difference between 5-year Treasuries and 20-year Treasuries, or between Treasuries and BAA corporates, is not a rounding error — it has historically been the difference between a retirement that survives comfortably and one that collapses in 15 years.
All simulations sweep monthly cohorts from January 1930 through the present at a 4.0% SWR, capped at a 40-year horizon to prevent timeline truncation bias. Bengen's original analysis used a 30-year horizon; I extended the horizon to 40 years to stress-test longer retirements, which matters particularly for early retirees.
1. A Better Definition of Retirement Failure
Bengen's original 4% rule framework relies on two core assumptions:
- Solvency Criterion ($0 Balance): A portfolio "passes" as long as account value stays strictly above $0 through the end of the timeline.
- 30-Year Horizon: Bengen validated his 4% rule across a 30-year retirement window. I extended this to 40 years throughout this post, as longer horizons are critical for early retirees (FIRE).
Why a "Wealth Reaches $0" Definition is Inadequate
The standard zero-balance definition is inadequate for a behavioral analysis. In practice, a retiree who has lost 40% of their real purchasing power in the first few years of retirement is not going to continue following the plan. The psychological and behavioral reality is that most people would capitulate, sell, cut spending, or seek work long before their account reaches zero. The $0 failure threshold measures mathematical solvency, not behavioral viability.
To capture this, I used a Behavioral Capital Floor. A cohort is marked as a behavioral failure the moment its real purchasing power breaches a time-scaled floor:
Floor(t) = Initial Principal × max(0.05, 0.60 × (Years Remaining / Total Horizon))
At the start of a 40-year retirement, a cohort fails if real wealth ever drops below 60% of initial principal. The floor decays linearly to 5% by year 40, relaxing the constraint as the horizon shortens — reflecting that a small balance late in retirement is less alarming than the same balance in year two.
The chart below shows what this means for the classic Bengen scenario: a passive 50/50 portfolio of S&P 500 and 5-Year U.S. Treasuries at 4.0% SWR.
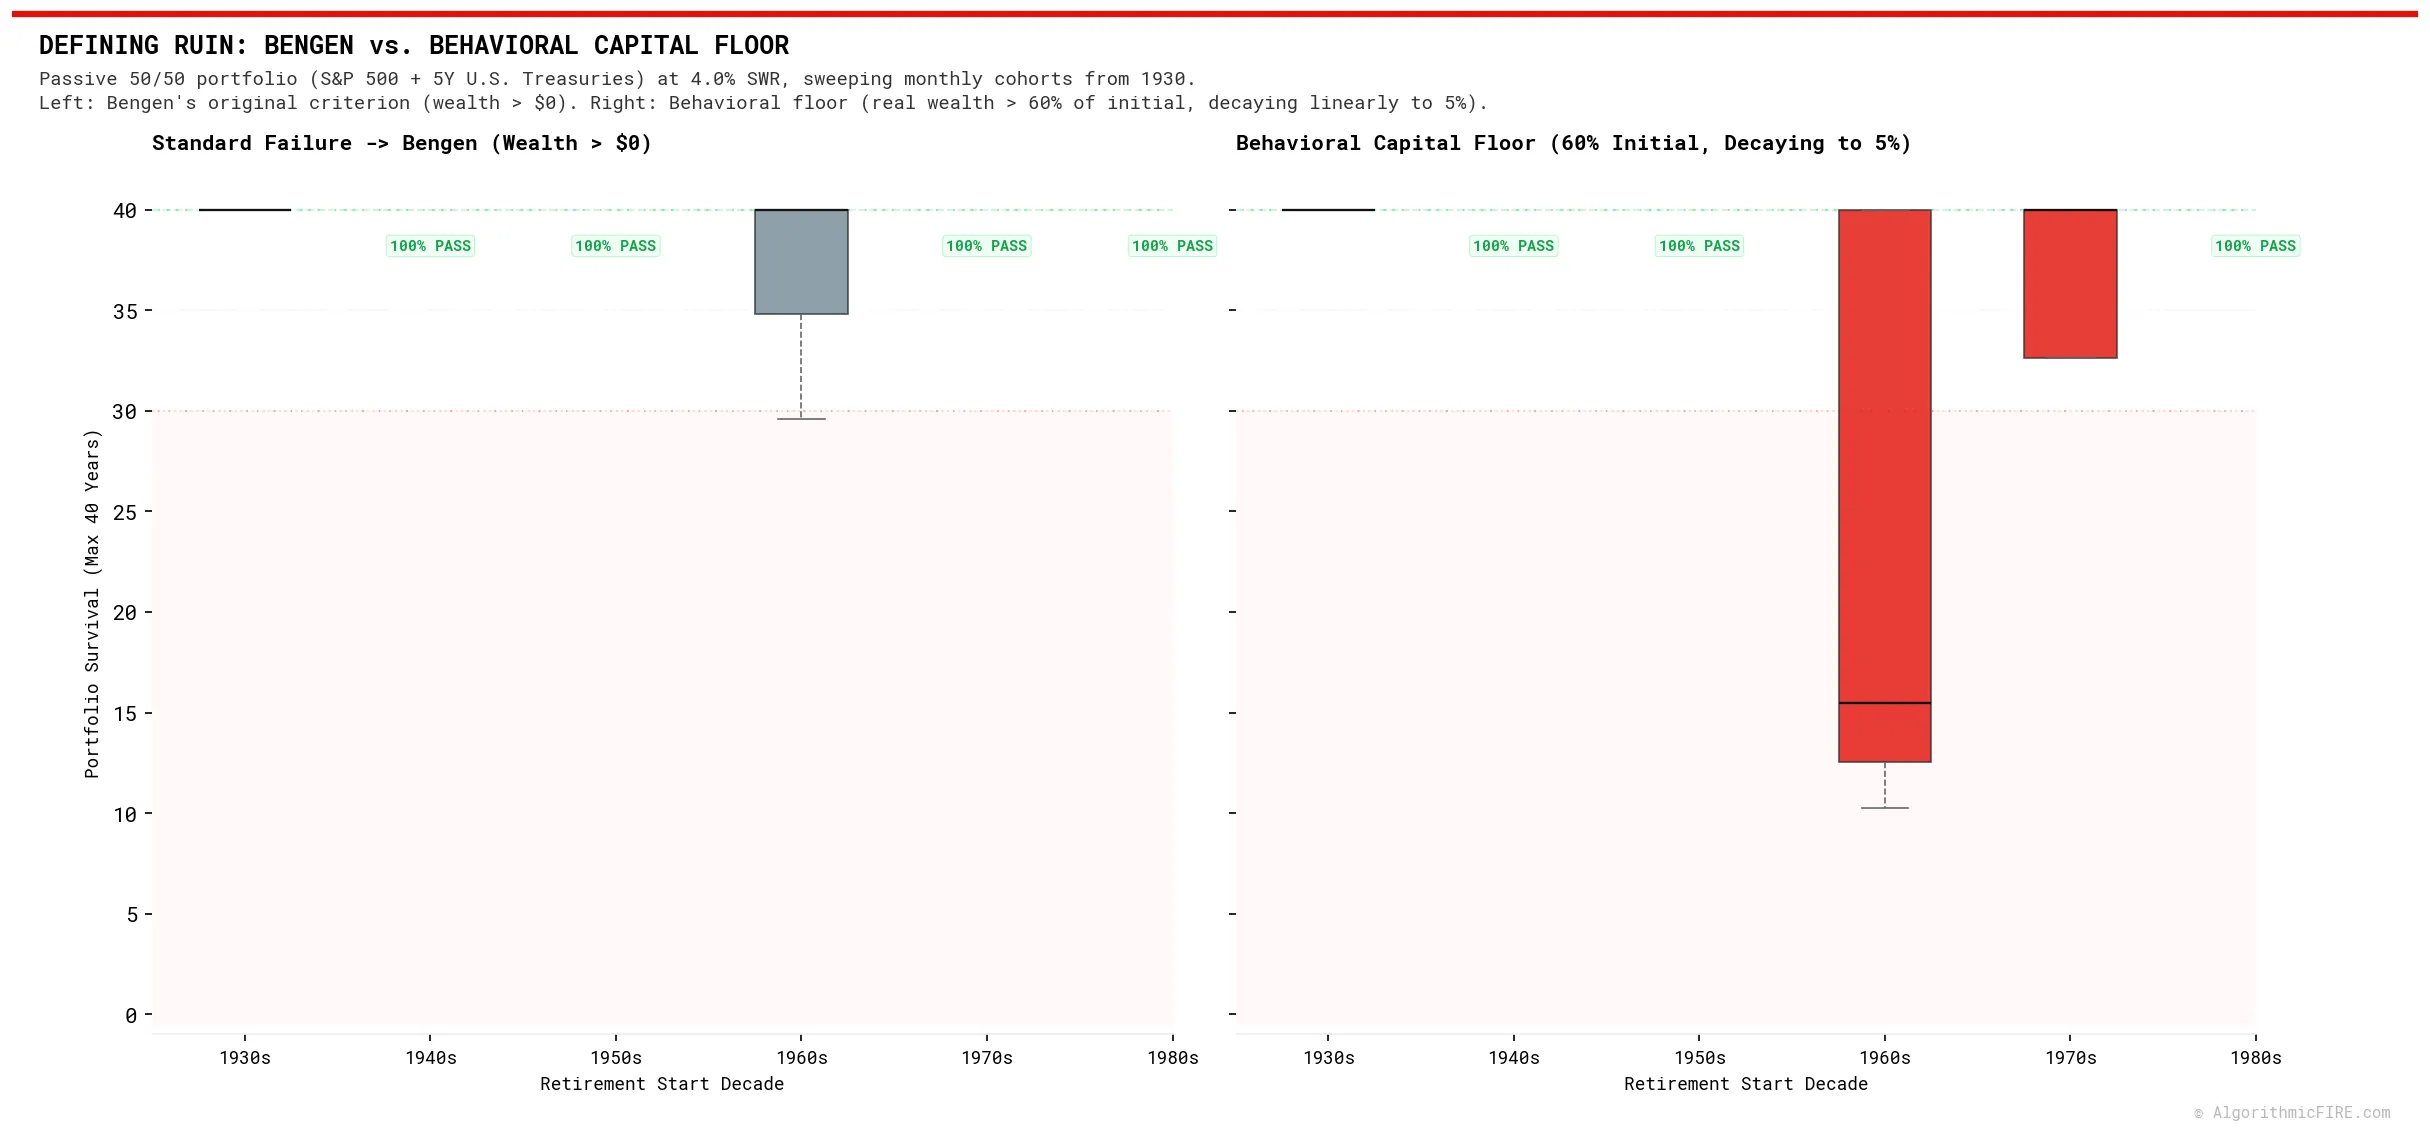
The contrast between the two panels makes the point clearly:
- 1960s cohorts: Under Bengen's original 30-year criterion, nearly all 1960s cohorts passed — consistent with his published findings, and confirming my replication is accurate. Extending the horizon to 40 years under the same $0 solvency definition, only 53% of cohorts completed the full window. Under my Capital Floor, that falls further to 36% passed — and the median portfolio survival collapsed to 15.46 years. Each step reveals failure that the prior step concealed.
- 1970s cohorts: Bengen's metric shows 100% pass — not a single portfolio went to zero. Yet the Capital Floor reveals that 25% of these cohorts breached the behavioral threshold, with the interquartile range (IQR) of survival spanning roughly 33 to 40 years. Mathematically solvent; behaviorally vulnerable.
- 1930s: Both methods show a pass rate near 90%, and no bar is visible in either panel because the small number of failures occur very late in the simulation — cohorts that failed did so around years 38–39, well beyond Bengen's original 30-year window. Every single 1930s cohort would have passed under Bengen's original criterion.
- 1940s, 1950s, 1980s: 100% pass under both definitions.
Every simulation in the remainder of this post uses a 40 year horizon and the Behavioral Capital Floor as the failure criterion.
2. Defining the Portfolios & Simulation Methodology
To evaluate the impact of bond maturity, credit quality, and active management, I compared two primary portfolio architectures built from the S&P 500, various bond indices, and 3-Month Treasury Bills (the cash exit destination):
- Passive Stock-Bond Mix (Buy & Hold): The classic static asset allocation benchmark. It holds a fixed ratio of equities (S&P 500 total return index, dividends reinvested) and bonds (either U.S. Treasuries or Moody's Corporate bonds, depending on the simulation), rebalanced annually back to target weights.
- Dynamic Stock-Bond Mix (ER_MMA Overlay): The active risk-managed alternative. It holds the same asset ratio, but applies the Excess Return Multiple Moving Average (ER_MMA) trend-following model independently to both the equity and bond sleeves. Rather than relying on a single moving average, ER_MMA uses an ensemble of multiple moving average lookback windows to dynamically scale allocation (0%, 33.3%, 66.7%, or 100%) in the target asset based on excess return over cash (3-Month Treasury Bills), sweeping uninvested capital into T-bills to defend against capital losses.
Note: All trend-following simulations incorporate a conservative 0.05% trading fee (slippage) on transacted volumes when a sleeve shifts allocation. Withdrawal amounts are adjusted annually for CPI inflation, matching Bengen's original methodology, but portfolio survival is capped at 40 years under my Behavioral Capital Floor metric.
3. Does Your Bond Choice Matter? (Duration & Credit Sensitivity)
Given the Capital Floor as my metric, how much does the choice of bond affect outcomes? I simulated a balanced 50/50 stock-bond portfolio across two dimensions:
- Duration: Intermediate 5-Year constant maturity vs. Long 20-Year constant maturity
- Credit tier: U.S. Treasuries (rate risk only), Moody's AAA Corporates, and Moody's BAA Corporates (lowest investment-grade tier)
- Management style: Passive buy-and-hold vs. Dynamic ER_MMA (Excess Return Multi-Sleeve Moving Average) trend-following applied to both sleeves
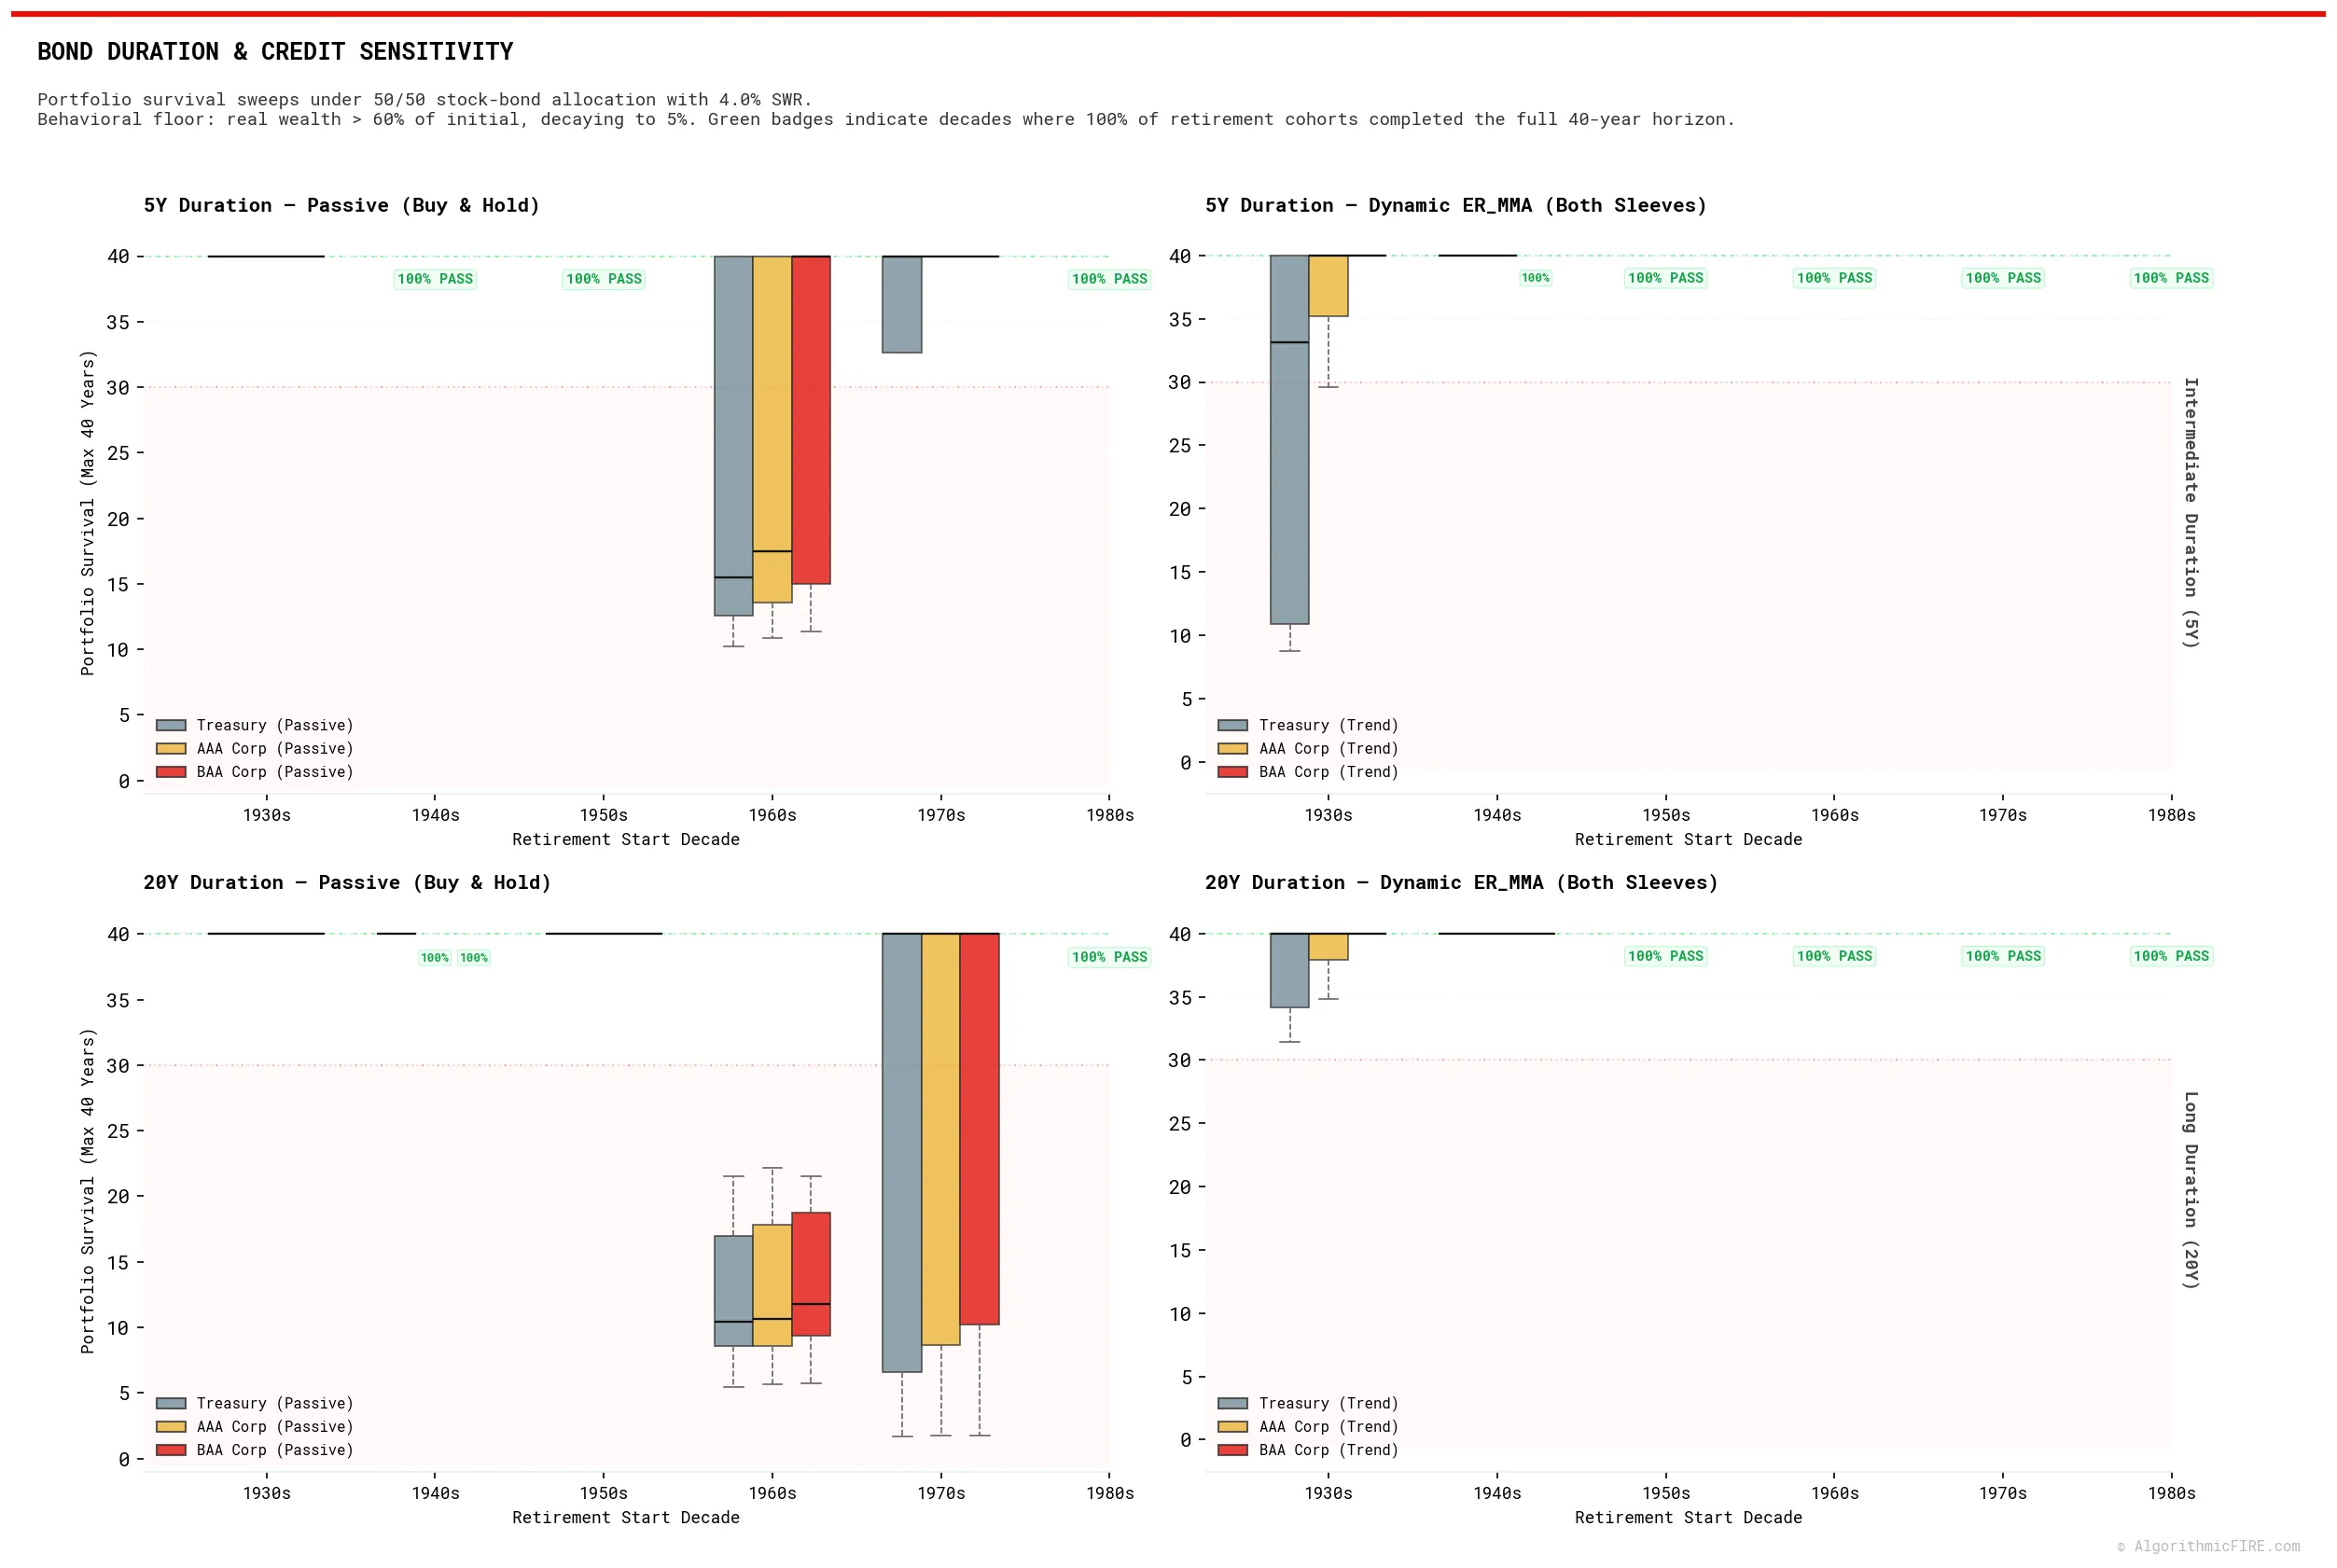
How to Read This Chart: Each boxplot summarizes the distribution of portfolio survival years across all monthly cohorts starting in that decade. The colored box covers the middle 50% of outcomes (25th to 75th percentile) with the center line marking the median, while the whiskers show the full range of survival times. A green "100% PASS" badge indicates that every cohort in that decade completed the full 40-year retirement without breaching the capital floor.
Key Observations
Passive Portfolios (Buy & Hold)
- The 1960s Stagflation Collapse:
- A portfolio with a Passive 5Y Treasury bond sleeve survived a median of only 15.46 years in the 1960s, with just 36% of cohorts completing the full horizon. High inflation eroded real purchasing power while rising interest rates generated capital losses in the bond sleeve — simultaneously destroying both sides of the 50/50 portfolio.
- Switching the bond sleeve to Passive 5Y AAA Corporates slightly improved median survival to 17.50 years (48% full pass), but did not change the overall failure regime.
- Utilizing Passive 5Y BAA Corporates in the bond sleeve improved the portfolio to a 40-year median (62% full pass). The higher credit spread provided a yield buffer against inflation, though over one-third of these cohorts still failed behaviorally.
- Passive 20Y Bonds Failed Catastrophically Across Both the 1960s and 1970s:
- 1960s Cohorts: Suffered rapid early ruin as 20Y Treasury portfolios collapsed to a 10.21-year median survival (only 2% completed 40 years). AAA Corporates fell to 10.62 years (8% pass) and BAA Corporates to 11.79 years (16% pass). Rising interest rates destroyed bond capital value right as inflation eroded real purchasing power.
- 1970s Cohorts: Long duration remained severely vulnerable. Under Bengen's original $0 rule, 10.0% of 1970s cohorts with 20Y Treasuries suffered complete zero-balance bankruptcy. Under my Capital Floor metric, 40.8% of 20Y Treasury cohorts failed, breaching the 60% real wealth threshold within a mean of just 7.10 years of retirement due to early-1970s stagflation and late-70s Volcker rate hikes.
Dynamic Portfolios (ER_MMA Overlay)
- 1960s Rate-Hike Failures Controlled & Mitigated:
- Applying the ER_MMA trend filter to both sleeves achieved 40-year median survival across all bond types and durations in the 1960s. Corporate bonds (AAA and BAA) achieved 100% full pass, while Treasuries reached 78%–93% full pass. The trend signal rotated the bond sleeve into cash (T-bills) during rising-rate periods, preventing the catastrophic capital losses that destroyed passive portfolios.
- The 1930s Trend Whipsaw Cost & Credit Compensation:
- The Great Depression created a choppy, mean-reverting environment for trend signals. A dynamic portfolio holding a 5Y Treasury bond sleeve dropped to a 31.17-year median in the 1930s (26% full pass) due to trading friction.
- Adding credit spread compensated significantly for this whipsaw cost: a Dynamic 5Y AAA sleeve achieved 54% pass, while a Dynamic 5Y BAA sleeve reached 85% full pass (40-year median) in the 1930s.
Behavioral Capitulation vs. Mathematical Recovery: Some of the passive cohorts that failed the Capital Floor test in the 1930s and 1960s actually finished the 40-year horizon with an account balance above $0 (thus passing Bengen's rule). However, because they suffered early drawdowns exceeding 40% of their real purchasing power, they are categorized here as behavioral failures. In the real world, a retiree is highly unlikely to stay the course through a 40%+ drop in their real net worth; they would capitulate and lock in losses, making eventual mathematical recovery irrelevant.
4. Does the Stock-Bond Split Matter? (Allocation Sweep)
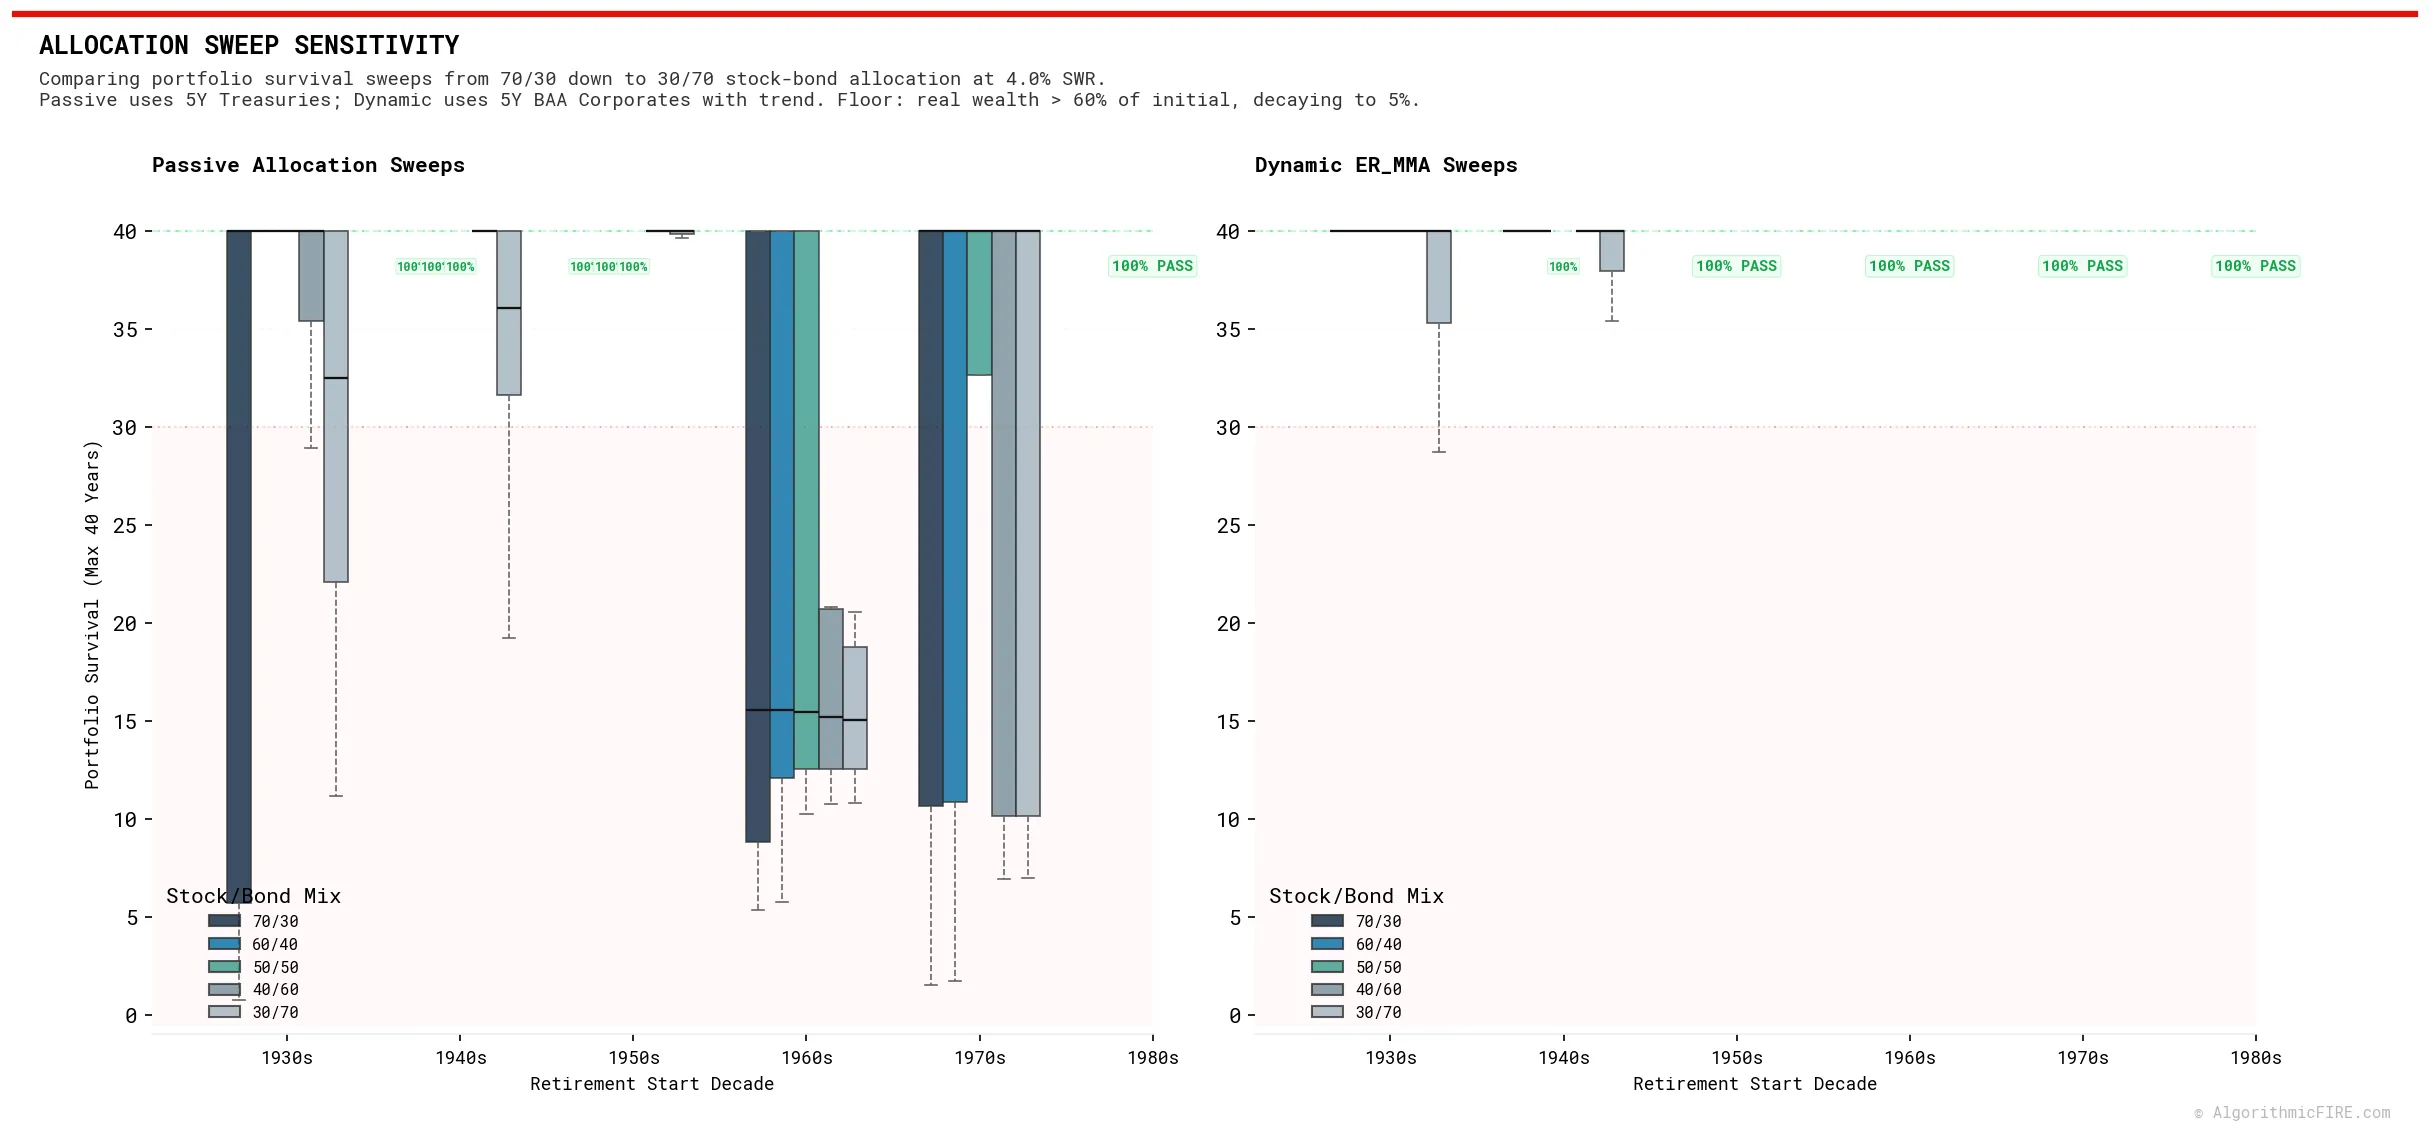
To isolate the effect of the stock-bond ratio, I swept five allocations from 70/30 down to 30/70. Since Chart 2 identified the best bond for each style, the comparison is designed as a fair contest:
- Passive panel: 5-Year U.S. Treasuries (the standard Bengen bond)
- Dynamic panel: 5-Year BAA Corporates with ER_MMA trend-following (the strongest bond from Chart 2)
Key Observations
- Passive stock-bond allocations all fail the same way in the 1960s:
- Across all five stock-bond allocations, the 1960s produced 15–16 year median survivals under the Capital Floor. Whether a retiree held 70% stocks or 30% stocks, the bond sleeve dragged outcomes into failure territory. Diversification did not help because both equities and bonds underperformed inflation-adjusted real returns simultaneously. While some equity-heavy passive portfolios eventually recovered mathematically by year 40, they suffered devastating real-value drawdowns early on that breached the behavioral threshold.
- Conservative passive allocations (30% stocks / 70% bonds) show additional weakness in the 1930s (32.50-year median SWR survival, 31% pass) and 1940s (36.08-year median, 35% pass), where low Treasury yields were insufficient to sustain 40 years of real withdrawals.
- Dynamic BAA eliminated decade-level failures at and above 50/50 stock weight:
- The Dynamic 70/30, 60/40, and 50/50 portfolios achieved 85–100% full pass in every decade including the 1930s and 1960s (and 94%–100% pass across all post-1930s decades). The BAA credit spread combined with trend-following provided enough yield and downside protection to prevent the portfolio from ever breaching the behavioral floor.
- Dynamic 40/60 (40% stocks) shows some degradation in the 1930s (62% pass) and 1940s (83% pass) — where the relatively modest equity weight limited the portfolio's ability to recover from early drawdowns.
- Dynamic 30/70 (30% stocks) shows the most vulnerability: 57% full pass in the 1930s and 60% in the 1940s. With the stock sleeve reduced to 30%, the portfolio lacks sufficient compounding power to consistently sustain 40 years of 4% real withdrawals under a behavioral floor constraint, even with BAA corporate trend bonds protecting the downside.
Key Takeaways
Four practical conclusions emerge from this sensitivity analysis:
- Risk-managed trend-following restores 40-year viability to the 4% rule: Under a realistic Behavioral Capital Floor, a passive 50/50 portfolio collapses to a 15.46-year median survival in the 1960s. Applying the ER_MMA trend overlay with BAA corporate bonds restores 40-year survival rates to 85%–100% across all historical stress decades (and 99%–100% in the 1960s and 1970s).
- Avoid long bond durations in passive portfolios: 20-Year bonds are an SWR catastrophe in inflationary or rate-hiking regimes. If holding bonds passively, intermediate maturities (5Y or shorter) substantially reduce duration risk.
- Credit quality matters, but is not a silver bullet passively: In the 1960s, 5Y BAA corporates outperformed Treasuries and AAA bonds in passive portfolios — but 38% of cohorts still breached the behavioral floor. The credit spread helped, but did not prevent failure across the board.
- Trend-following on the bond sleeve rescues passive failure modes: Applying the ER_MMA trend filter to both sleeves dramatically improved 1960s outcomes across all bond types — achieving 100% pass for corporate bonds and 78%–93% pass for Treasuries, converting a decade of near-universal behavioral failure into largely survivable territory. The combination of BAA corporate credit spread and trend signal also largely resolved the 1930s whipsaw problem present in Treasury-only dynamic portfolios.
Bonus Benchmark: 100% Historical Pass Max SWR Comparison
To provide a direct reference for readers evaluating traditional SWR rules versus my Behavioral Capital Floor, the table below shows the Maximum Safe Withdrawal Rate (Max SWR) that achieved 100% survival across all historical monthly cohorts (1930–present) under both Bengen's original $0 solvency metric and my 40-year Behavioral Capital Floor:
| Portfolio Architecture | 30-Year Horizon (Bengen $0 Solvency) | 40-Year Horizon (Bengen $0 Solvency) | 40-Year Horizon (Behavioral Capital Floor) |
|---|---|---|---|
| Passive 50/50 (5Y Treasuries) | 3.95% | 3.65% | 3.05% |
| Dynamic 50/50 (5Y BAA Trend) | 4.10% | 3.60% | 3.55% |
| Dynamic 60/40 (5Y BAA Trend) | 4.05% | 3.65% | 3.40% |
| Dynamic 70/30 (5Y BAA Trend) | 4.05% | 3.65% | 2.40% |
Key Takeaway: In Bengen's original 30-year window, active trend management boosts the 100% safe withdrawal rate from 3.95% to 4.10% (+15 bps). Over a 40-year early-retirement horizon under the Behavioral Capital Floor, active trend management increases the 100% safe withdrawal floor from 3.05% to 3.55% (+50 bps).
Note on Dynamic 70/30 (2.40% Floor Max SWR): Stock-heavy portfolios (70% equities) carry a smaller bond/cash cushion (30%). During severe post-war inflation spikes like February 1946, the 70% equity allocation suffered an early drawdown that breached the 60% real wealth floor at withdrawal rates above 2.40% (month 32). In contrast, moderate allocations (50/50 and 60/40) hold larger bond/cash buffers that cushion these early real-wealth declines, sustaining 100% survival at much higher safe withdrawal floors (3.40%–3.55%).
Data Sources, Provenance & Model Limitations
To ensure absolute mathematical reproducibility and analytical transparency, the underlying datasets, conjoining boundaries, and historical modeling assumptions are documented below:
1. Primary Data Registry
| Asset / Metric | Source Agency | Series ID / Endpoint | Splicing & Conjoining Boundary | Modeling Details |
|---|---|---|---|---|
| S&P 500 Daily OHLC | Yahoo Finance | ^GSPC | Continuous (1927–Present) | Daily resolution; adjusted close includes dividends. |
| Consumer Price Index | Bureau of Labor Statistics | FRED CPIAUCNS | Continuous (1927–Present) | Monthly resolution; forward-filled to daily. Used for real-wealth SWR adjustments. |
| 3-Month Treasury Yield | Federal Reserve (FRED) & NBER | M1329AUSM193NNBR / TB3MS | Spliced on January 1, 1934 | Pre-1934 utilizes NBER daily average short-term security notes; post-1934 utilizes standard FRED 3-Month T-Bill yields. |
| 5-Year Treasury Yield | Federal Reserve (FRED) & Shiller | GS5 / Long Interest Rate | Spliced on April 1, 1953 | Pre-1953 utilizes Robert Shiller's 10-Year Long-Term Interest Rate series minus a fixed 0.60% term premium adjustment; post-1953 uses FRED GS5. |
| 20-Year Treasury Yield | Federal Reserve (FRED) & Shiller | GS20 / Long Interest Rate | Spliced on April 1, 1953 | Pre-1953 utilizes Robert Shiller's 10-Year Long-Term Interest Rate series directly; post-1953 uses FRED GS20 continuous 20-year constant maturity yield. |
| Moody's AAA Corporate Yield | Federal Reserve (FRED) | AAA | Continuous (1919–Present) | Used for high-grade corporate bond SWR calculations; forward-filled to daily. |
| Moody's BAA Corporate Yield | Federal Reserve (FRED) | BAA | Continuous (1919–Present) | Used for lower-tier investment-grade corporate bond SWR calculations; forward-filled to daily. |
| S&P 500 Dividend Yield | Robert Shiller Database | multpl.com monthly S&P yield | Continuous (1871–Present) | Linearly resampled and accrued daily: Annual Yield / 252. |
2. Splicing Proxy Disclosures & Term Premium Sensitivity
- Pre-1953 5-Year & 20-Year Treasury Proxies: Constant-maturity 5-Year (
GS5) and 20-Year (GS20) Treasury yield data are not published before April 1953. Pre-1953 5-Year yields are estimated using Robert Shiller's 10-Year Long-Term Interest Rate series minus a 0.60% (60 bps) term premium proxy (matching WWII interest-rate peg spreads). Pre-1953 20-Year Treasury yields utilize Shiller's 10-Year Long-Term Interest Rate series directly. Post-April 1953 yields utilize continuous FREDGS5andGS20series. - Corporate Bond Duration Modeling: Moody's FRED series (
AAAandBAA) measure continuous seasoned corporate bond yield-to-maturity (historically centered around ~20-year maturities) starting in 1919. No separate 5-Year corporate yield series is available for the full historical period; therefore, 5-Year intermediate corporate returns use the same Moody's yield baseline as 20-Year corporate bonds, implicitly assuming a flat corporate yield curve across maturities. The direction of the resulting bias is time-varying: during normal (upward-sloping) yield curves the 5-Year corporate yield is slightly overstated, and during inverted yield curves it is slightly understated. Over a 90-year backtest spanning multiple yield curve regimes, these errors are mean-reverting rather than systematically cumulative. This assumption follows the Ibbotson/SBBI constant-maturity synthetic bond index methodology standard in long-horizon historical SWR research. - Dividend Yield Accrual Smoothing: S&P 500 dividends are modeled as a smooth daily linear accrual (Yield / 252) rather than lumpy quarterly distributions. This is standard in 90-year historical backtests to avoid dependency on specific dividend declaration dates, introducing negligible variance to long-term SWR survival math.
- Execution lag & slippage: All systematic trend-following allocations incorporate a next-day open execution lag (signals calculated at Close T, executed at Open T+1) and a fixed 0.05% (5 bps) transaction slippage fee.